
MEC-250 · Lesson 6 of 12 · 31 min
Failure: fracture, fatigue and creep
With the material confirmed to specification, Jonah and Amira went back to the fracture surface itself. Under a stereo microscope it told a clear story. A smooth, flat region covered about four-fifths of the cross-section, marked with curved bands like the growth rings of a tree, all centred on one point at the edge of the shaft. That point sat exactly in the fillet where the shaft steps down from its bearing journal to the splined end. The remaining fifth of the surface, opposite the origin, was rough and grainy. The shaft had not broken in one overload. A crack had started at the fillet and grown slowly, a little with each revolution, for many hours, until the remaining section was too small to carry the load. That is fatigue, the most common cause of failure in machine parts, and this lesson covers it along with fracture and creep.
Ductile and brittle fracture
Fracture is the separation of a body into pieces under stress. Ductile fracture is preceded by substantial plastic deformation. In a tensile test of a ductile metal, the neck develops small voids, often at inclusions, which grow and join into a crack at the centre; the crack then runs outward and finishes as a shear lip at 45°, giving the classic cup-and-cone fracture. Under a scanning electron microscope, a ductile fracture surface is covered with dimples, each the half of a void. Ductile fracture absorbs a lot of energy and gives warning, because the part deforms visibly before it fails.
Brittle fracture happens with little or no plastic deformation, and the crack runs very fast, often at a large fraction of the speed of sound. In many metals the crack travels by cleavage, splitting the grains along particular crystal planes; the surface looks bright and faceted, and often shows chevron or river patterns that point back to the origin. In other cases the crack follows the grain boundaries, giving intergranular fracture, which suggests something has weakened the boundaries, such as segregated impurities, hydrogen or corrosion. Brittle fracture is dangerous because it can occur at stresses below the yield strength and without warning.
Stress concentrations and the Griffith idea
The measured fracture strength of brittle materials is often a hundred times lower than the theoretical cohesive strength. In the 1920s A. A. Griffith explained why: real materials contain small cracks, and the stress at the tip of a crack is much higher than the average stress. For an elliptical hole of half-length \(a\) and tip radius \(\rho\) in a plate under remote stress \(\sigma_0\), the maximum stress at the tip is approximately
A sharp crack, with a tip radius of a few atomic spacings, magnifies the stress enormously. The ratio \(K_t = \sigma_{\max}/\sigma_0\) is the stress concentration factor. Holes, grooves, threads, keyways and shoulder fillets in machine parts all act as stress raisers, though much milder ones than cracks; their factors are tabulated in design handbooks as functions of geometry. In a ductile metal, local yielding at a notch blunts the peak and redistributes the load under steady loading, so notches matter less for static strength. Under cyclic loading and in brittle materials, they matter a great deal.
Fracture toughness
Fracture mechanics treats the crack directly. The stress field near the tip of any crack in a linear elastic material scales with a single quantity, the stress intensity factor:
Here \(\sigma\) is the nominal stress, \(a\) the crack length (the full length of an edge crack, or half the length of an internal crack) and \(Y\) a dimensionless factor of order one that depends on geometry; for a small edge crack in a wide plate, \(Y \approx 1.12\). A crack grows unstably when \(K\) reaches a critical value, the fracture toughness. Under the plane strain conditions found in thick sections, this critical value is a material property, \(K_{Ic}\), measured with standard precracked specimens and expressed in MPa·m\(^{1/2}\) (or ksi·in\(^{1/2}\); the two units differ by less than 10 percent).
| Material | Yield strength (MPa) | K_Ic (MPa·m^1/2) |
|---|---|---|
| Low-carbon structural steel | 250–350 | 100–200 (ductile at room temperature) |
| Quenched and tempered alloy steel, ~31 HRC | 800–900 | 80–120 |
| Ultra-high-strength steel, ~55 HRC | 1600–1900 | 30–50 |
| High-strength aluminium alloy | 450–500 | 25–35 |
| Titanium alloy Ti-6Al-4V | 850–950 | 50–80 |
| Alumina and silicon nitride | — | 3–6 |
| Glass | — | 0.7–0.9 |
The relation gives three ways to use the idea. Knowing the stress and the material, we can find the critical crack size and set inspection limits. Knowing the largest crack that inspection might miss, we can find the maximum safe stress. And knowing the stress and crack size, we can choose a material with enough toughness.
Worked problem
Critical crack size in two steels
An edge crack (\(Y = 1.12\)) is present in (a) a quenched and tempered steel with \(K_{Ic} = 90\ \text{MPa·m}^{1/2}\) stressed to 600 MPa, and (b) an ultra-high-strength steel with \(K_{Ic} = 40\ \text{MPa·m}^{1/2}\) stressed to 1000 MPa. Find the critical crack length in each.
Show solution
- Rearrange \(K_{Ic} = Y\sigma\sqrt{\pi a_c}\):
- \[a_c = \frac{1}{\pi}\Big(\frac{K_{Ic}}{Y\sigma}\Big)^2\]
- (a) \(a_c = \dfrac{1}{\pi}\Big(\dfrac{90}{1.12 \times 600}\Big)^2 = \dfrac{(0.1339)^2}{\pi} = 5.7 \times 10^{-3}\ \text{m} = 5.7\ \text{mm}\).
- (b) \(a_c = \dfrac{1}{\pi}\Big(\dfrac{40}{1.12 \times 1000}\Big)^2 = 4.1 \times 10^{-4}\ \text{m} = 0.41\ \text{mm}\).
Answer: The stronger steel carries 67 percent more stress, but a crack less than half a millimetre long, hard to find by routine inspection, is enough to break it. This is why aircraft landing gear and other parts made of very strong steels need rigorous inspection, and why designers do not simply use the strongest steel available.
Impact testing and the ductile-to-brittle transition
Before fracture mechanics was developed, engineers measured toughness with impact tests, and the Charpy test is still used everywhere in specifications. A notched bar about 10 mm square is struck by a swinging pendulum, and the energy absorbed in breaking it is read from how high the pendulum rises afterward. The test is quick and cheap, and although the energy is not a design property like \(K_{Ic}\), it ranks materials and reveals temperature effects very clearly.
BCC metals, including ordinary carbon and low-alloy steels, show a ductile-to-brittle transition: at high temperatures they absorb a lot of energy and break with ductile, fibrous fractures, but below a transition temperature the energy drops sharply and the fracture becomes brittle cleavage. FCC metals such as aluminium, copper and austenitic stainless steel show no such transition, which is why they are used for cryogenic tanks. The transition temperature depends on composition, grain size and processing; fine grains lower it, while high carbon, phosphorus and coarse grains raise it.
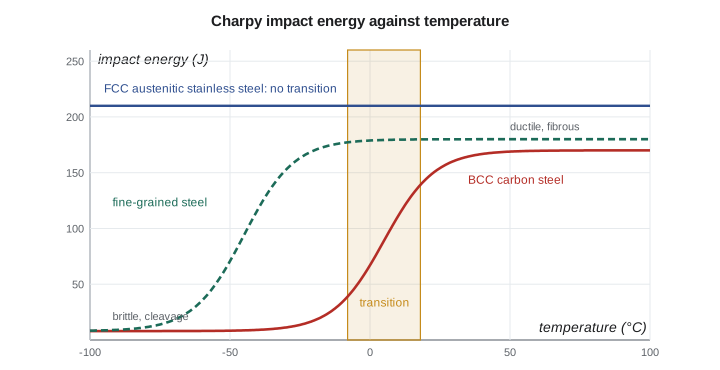
The transition caused some of the most famous failures in engineering history. Several welded Liberty cargo ships built during the Second World War cracked in two, some while moored in calm water, because their steel was brittle in cold North Atlantic conditions and the welded hulls gave a running crack no place to stop. Since then, codes for ships, bridges, pressure vessels and pipelines have specified a minimum Charpy energy at the lowest design temperature. Kestrel's forestry equipment works in the winter at temperatures that can reach −40 °C, so its frame steels are specified with Charpy energy at that temperature.
Fatigue
Fatigue is failure under repeated or fluctuating stress at levels well below the static strength. It causes most service failures of shafts, axles, gears, springs, bolts, crankshafts and aircraft structures. A fatigue crack usually starts at the surface, at a stress raiser such as a fillet, keyway, hole, thread root, machining mark, corrosion pit or inclusion. It grows a tiny amount with each cycle, often less than a micrometre, until the remaining cross-section can no longer carry the peak load and the part fails suddenly by overload.
Fatigue fracture surfaces are distinctive. The region of slow crack growth is smooth and often shows beach marks, curved bands marking where the crack front paused or changed speed as the loading changed, for example when the tractor was stopped and restarted. Under the electron microscope, much finer striations can be seen, each the advance of the crack in one cycle. The final overload region is rough. The relative sizes of the two regions say something about the stress: a small final fracture zone, as on Kestrel's shaft, means the crack grew until it was very large, so the nominal stress was low and the failure was driven by the stress concentration.
Fluctuating stresses are described by their maximum \(\sigma_{\max}\), minimum \(\sigma_{\min}\), mean \(\sigma_m = (\sigma_{\max} + \sigma_{\min})/2\), amplitude \(\sigma_a = (\sigma_{\max} - \sigma_{\min})/2\) and stress ratio \(R = \sigma_{\min}/\sigma_{\max}\). A rotating shaft under steady bending sees fully reversed stress, with \(R = -1\) and zero mean, because each point on the surface passes from tension to compression once per revolution.
Fatigue data are plotted as S–N curves of stress amplitude against the number of cycles to failure on a logarithmic scale. Steels and titanium alloys show a fatigue limit or endurance limit, a stress amplitude below which failure does not occur even after very many cycles, in the absence of corrosion. For steels the rotating-beam endurance limit of polished specimens is roughly half the tensile strength, up to a tensile strength of about 1400 MPa. Aluminium and copper alloys have no true fatigue limit, so their fatigue strength is quoted at a stated number of cycles, such as \(5 \times 10^8\).
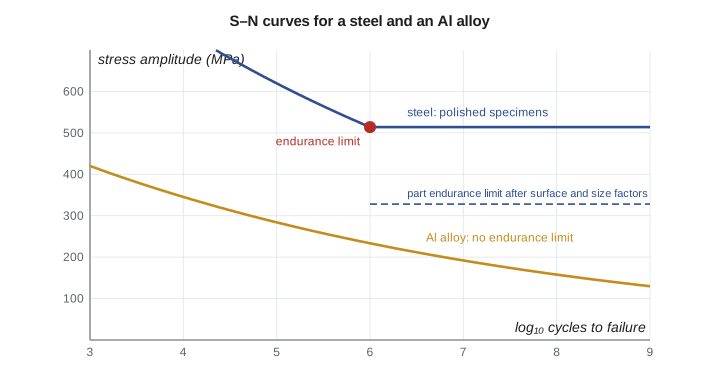
Real parts have lower fatigue strength than polished laboratory specimens. Designers correct the endurance limit with factors for surface finish, size, loading type, temperature and reliability, and they account for notches with the fatigue stress concentration factor \(K_f = 1 + q(K_t - 1)\), where the notch sensitivity \(q\), between 0 and 1, is close to 1 for high-strength steels and sharp notches. A tensile mean stress lowers the allowable amplitude; the modified Goodman line, \(\sigma_a/S_e + \sigma_m/S_{ut} = 1\), is a common conservative rule.
Worked problem
Why the shaft broke
The shaft steel has a tensile strength of 1028 MPa. The machined surface and size give factors of 0.75 and 0.85. Under the heaviest regular PTO duty, the nominal bending stress amplitude at the fillet is 180 MPa, fully reversed. The drawing specifies a fillet radius of 1.6 mm, giving \(K_t = 1.7\). Rosa measured the actual radius on the broken shaft as 0.4 mm, giving \(K_t = 2.6\). Take \(q = 0.90\).
Show solution
- Endurance limit of the part: \(S_e = 0.75 \times 0.85 \times 0.5 \times 1028 = 328\ \text{MPa}\).
- As designed: \(K_f = 1 + 0.90(0.7) = 1.63\), so the local amplitude is \(1.63 \times 180 = 293\ \text{MPa}\), below 328 MPa.
- As made: \(K_f = 1 + 0.90(1.6) = 2.44\), so the local amplitude is \(2.44 \times 180 = 439\ \text{MPa}\), well above 328 MPa.
Answer: The design was sound, with a modest margin. The part as made was not: a tool with the wrong nose radius had cut a sharp fillet, raising the local stress by half. Kestrel traced the problem to one lathe and one batch, quarantined the remaining shafts from that batch, and added a radius gauge check to the inspection plan. The manganese sulphide stringers Rosa found were not at the origin and played no part.
Fatigue crack growth
Once a crack exists, its growth rate per cycle depends on the range of stress intensity, \(\Delta K = Y\Delta\sigma\sqrt{\pi a}\). Over a wide middle range of growth rates, the Paris law applies:
For steels, \(m\) is about 3 and \(C\) about \(10^{-12}\) when \(da/dN\) is in metres per cycle and \(\Delta K\) in MPa·m\(^{1/2}\). Integrating from an initial crack size to the critical size gives the number of cycles a cracked part can survive. Aircraft and pressure vessel inspection intervals are set this way, a philosophy called damage tolerance: assume a crack just smaller than inspection can find is present, and make sure it cannot grow to critical size before the next inspection.
# Fracture mechanics, fatigue of the shaft fillet, crack growth and creep life
import math

# 1. Critical crack size: K = Y * sigma * sqrt(pi * a)
def a_crit(KIc, sigma, Y=1.12):
    return (KIc / (Y * sigma)) ** 2 / math.pi
print("material                       KIc    stress   critical edge crack")
for name, KIc, s in (("structural steel", 150, 250), ("Q&T alloy steel (shaft)", 90, 600),
                     ("high-strength steel", 40, 1000), ("Al alloy 7075-T6", 25, 300)):
    print(f"{name:28s} {KIc:5.0f}  {s:6.0f}    {1000 * a_crit(KIc, s):7.2f} mm")

# 2. Fatigue check at the shaft shoulder fillet
UTS = 1028.0
Se_prime = 0.5 * UTS            # rotating-beam endurance estimate for steels (UTS < about 1400 MPa)
ka, kb = 0.75, 0.85             # surface and size factors (typical for a machined 50 mm shaft)
Se = ka * kb * Se_prime
q = 0.90                        # notch sensitivity for this steel and radius range
sa = 180.0                      # nominal bending stress amplitude, MPa (fully reversed)
print(f"\nestimated endurance limit of the part: {Se:.0f} MPa")
for label, Kt in (("drawing radius 1.6 mm", 1.7), ("as-machined radius 0.4 mm", 2.6)):
    Kf = 1 + q * (Kt - 1)
    peak = Kf * sa
    verdict = "below the endurance limit" if peak < Se else "ABOVE the endurance limit"
    print(f"{label:26s}: Kt = {Kt:.1f}, Kf = {Kf:.2f}, local amplitude {peak:4.0f} MPa, {verdict}")

# 3. Fatigue crack growth: Paris law da/dN = C (dK)^m
C, m, Y, dsig = 1.0e-12, 3.0, 1.12, 200.0      # m/cycle, MPa sqrt(m)
a0, af = 0.5e-3, 5.0e-3
N_closed = 2 * (a0 ** -0.5 - af ** -0.5) / (C * (Y * dsig * math.sqrt(math.pi)) ** m)
N, a, steps = 0.0, a0, 20000                  # simple numerical integration as a check
h = (af - a0) / steps
for i in range(steps):
    am = a0 + (i + 0.5) * h
    N += h / (C * (Y * dsig * math.sqrt(math.pi * am)) ** m)
print(f"\ncycles to grow a crack from {a0 * 1000} to {af * 1000} mm: {N_closed:,.0f} (closed form), {N:,.0f} (numerical)")
print(f"at 540 rev/min, that is about {N_closed / 540 / 60:.0f} hours of running")

# 4. Mean stress: modified Goodman line, sa/Se + sm/UTS = 1
for sm in (0, 100, 200, 300):
    print(f"mean stress {sm:3d} MPa: allowable amplitude {Se * (1 - sm / UTS):4.0f} MPa")

# 5. Creep: Larson-Miller parameter LMP = T (20 + log10 t), T in K, t in hours
LMP = 22000.0
print("\nrupture life at a stress whose Larson-Miller parameter is 22 000:")
for Tc in (550, 600, 650, 700):
    T = Tc + 273.15
print(f" {Tc} C: {10 ** (LMP / T - 20):12,.0f} h")material KIc stress critical edge crack structural steel 150 250 91.35 mm Q&T alloy steel (shaft) 90 600 5.71 mm high-strength steel 40 1000 0.41 mm Al alloy 7075-T6 25 300 1.76 mm estimated endurance limit of the part: 328 MPa drawing radius 1.6 mm : Kt = 1.7, Kf = 1.63, local amplitude 293 MPa, below the endurance limit as-machined radius 0.4 mm : Kt = 2.6, Kf = 2.44, local amplitude 439 MPa, ABOVE the endurance limit cycles to grow a crack from 0.5 to 5.0 mm: 977,209 (closed form), 977,209 (numerical) at 540 rev/min, that is about 30 hours of running mean stress 0 MPa: allowable amplitude 328 MPa mean stress 100 MPa: allowable amplitude 296 MPa mean stress 200 MPa: allowable amplitude 264 MPa mean stress 300 MPa: allowable amplitude 232 MPa rupture life at a stress whose Larson-Miller parameter is 22 000: 550 C: 5,328,427 h 600 C: 157,083 h 650 C: 6,783 h 700 C: 405 h
The program's crack growth result, about a million cycles to grow a crack from 0.5 mm to 5 mm at a stress range of 200 MPa, corresponds to about 30 hours at the standard PTO speed of 540 rev/min. Once a fatigue crack has started in a rotating shaft, the remaining life is short. That is why fatigue design concentrates on preventing initiation: generous fillet radii, good surface finish, avoiding stress raisers in high-stress regions, and compressive residual stresses at the surface from shot peening, surface rolling, carburizing or induction hardening.
Creep
At elevated temperatures, metals and other materials deform slowly and continuously under constant stress, even below the yield strength. This is creep. It becomes significant above about 0.4 of the absolute melting temperature, which is above about 450 °C for steels, but at room temperature for lead, solders and many polymers. A creep test records strain against time at constant load and temperature. After the instantaneous elastic strain, primary creep shows a decreasing rate as the material strain hardens; secondary or steady-state creep proceeds at a nearly constant minimum rate, where hardening and recovery balance; and tertiary creep accelerates as voids form and the section necks, ending in rupture.
For design, engineers use either the steady-state creep rate, when deformation must be limited, or the rupture life. Because tests of tens of years are impractical, data from shorter tests at higher temperatures are extrapolated using parameters such as the Larson–Miller parameter, \(\text{LMP} = T(C + \log t_r)\), with \(T\) in kelvin, \(t_r\) in hours and \(C\) often about 20. For a given alloy, the LMP at a given stress is roughly constant, so a test at high temperature for a short time stands in for a long time at a lower temperature. Creep-resistant alloys have high melting points, stable fine precipitates, coarse grains or single crystals to limit grain-boundary sliding, and solid solution strengthening.
Worked problem
Creep life from the Larson–Miller parameter
At the operating stress, an alloy has a Larson–Miller parameter of 22 000 (with \(C = 20\)). Estimate its rupture life at 600 °C and at 650 °C.
Show solution
- At 600 °C, \(T = 873\ \text{K}\): \(\log t_r = 22\,000/873 - 20 = 5.20\), so \(t_r \approx 1.6 \times 10^5\ \text{h}\), about 18 years.
- At 650 °C, \(T = 923\ \text{K}\): \(\log t_r = 22\,000/923 - 20 = 3.83\), so \(t_r \approx 6.8 \times 10^3\ \text{h}\), under a year.
Answer: A 50 °C increase cuts the life by a factor of more than twenty. Creep life is extremely sensitive to temperature, which is why boiler tubes and turbine blades are monitored so closely and why a small overtemperature can consume years of life.
Common mistakes
MistakeAssuming a part cannot fail if the stress is below the yield strength.
InsteadFatigue, brittle fracture with a crack, and creep can all occur below yield.
MistakeIgnoring stress concentrations because the material is ductile.
InsteadUnder cyclic loading, local peak stresses at notches control fatigue life.
MistakeChoosing the strongest available steel for a cracked or crack-prone part.
InsteadToughness usually falls as strength rises, so the critical crack size shrinks.
MistakeUsing the polished-specimen endurance limit for a real part.
InsteadApply surface, size and other factors, and K_f at notches.
MistakeThinking creep matters only in jet engines.
InsteadIt matters above about 0.4 T_m, which includes polymers and solders at room temperature.
Summary and key terms
- Ductile fracture shows necking and dimples; brittle fracture is flat, by cleavage or along grain boundaries.
- Cracks and notches concentrate stress; σ_max ≈ 2σ₀√(a/ρ).
- Fracture occurs when K = Yσ√(πa) reaches the fracture toughness K_Ic.
- BCC steels have a ductile-to-brittle transition; FCC metals do not.
- Fatigue cracks start at stress raisers and grow each cycle, leaving beach marks and striations.
- Steels have an endurance limit of roughly 0.5 UTS for polished specimens, reduced by surface, size and notch effects.
- Paris law, da/dN = C(ΔK)^m, gives crack growth life; creep life is extrapolated with the Larson–Miller parameter.
- Stress concentration factor
- The ratio of the peak local stress to the nominal stress at a notch.
- Stress intensity factor
- K = Yσ√(πa), describing the stress field near a crack tip.
- Fracture toughness
- The critical stress intensity factor for unstable crack growth, K_Ic in plane strain.
- Ductile-to-brittle transition
- The drop in impact energy of BCC metals below a transition temperature.
- Endurance limit
- The stress amplitude below which a steel does not fail by fatigue.
- Beach marks
- Macroscopic bands on a fatigue fracture showing successive crack front positions.
- Striations
- Microscopic ridges on a fatigue fracture, each from one load cycle.
- Creep
- Time-dependent plastic deformation under constant stress at elevated temperature.
Practice problems
Work each problem on paper first, then reveal the answer to check.
An internal crack 4 mm long (a = 2 mm, Y = 1.0) is found in a plate with K_Ic = 50 MPa·m^1/2. What stress causes fracture?
Show answer
σ = 50/√(π × 0.002) = 631 MPa.
A shaft surface sees stresses from −200 to +300 MPa. Find σ_m, σ_a and R.
Show answer
σ_m = 50 MPa, σ_a = 250 MPa, R = −0.67.
Estimate the polished rotating-beam endurance limit of a steel with UTS = 800 MPa.
Show answer
About 400 MPa.
Find K_f for K_t = 2.2 and q = 0.8.
Show answer
K_f = 1.96.
Using the Larson–Miller example, estimate the rupture life at 700 °C.
Show answer
About 400 h.
In the program, double the stress range to 400 MPa. How does the crack growth life change, and why?
Show answer
It falls by a factor of 8, because life varies as (Δσ)^(−m) with m = 3.
Lesson quiz · 5 questions
Score 60% or more to complete this lesson.
Create a free account to save your progress, take quizzes and earn a certificate.