
ITIL-140 · Lesson 11 of 12 · 29 min
Measuring and improving support practices
Each practice lesson in this course has introduced its own metrics. This lesson steps back and looks at measurement across the support practices as a whole: service level agreements and their targets, how to calculate and report achievement honestly, how to staff for demand, how to measure the user's experience and how to use measurement to drive improvement rather than gaming. It also looks at the role of automation and AI assistants, which ITIL-150 examines in more depth.
Service levels and targets
Service level management, covered in ITIL-141, sets clear, business-based targets for service performance and agrees them with customers. For support practices, typical targets include response and resolution times by incident priority, fulfillment times for request types, service desk answer times and availability of key services. These targets appear in service level agreements (SLAs) with customers and in operational level agreements (OLAs) between internal teams, and underpinning contracts with suppliers should support them.
Targets should be meaningful to the business and achievable. A target of resolving 100 % of P1 incidents within 4 hours sounds reassuring but is rarely realistic; a single difficult incident breaks it, and from then on the team has nothing to aim for in that period. Most organizations set percentage targets, such as 90 % of P1 incidents resolved within 4 hours, and report both the percentage and the worst cases.
Reporting achievement honestly
SLA reports are only useful if they are trustworthy. Common distortions include stopping the clock too freely (pausing while "waiting for the user" when the provider is actually the one delaying), reclassifying incidents to lower priorities to escape tight targets, closing tickets before the user confirms resolution, and excluding inconvenient periods. ITIL-110 called the result watermelon reporting: green on the outside, red inside. Clear rules for clock pauses and priority changes, audits of samples, and pairing SLA results with user satisfaction help keep reports honest.
Averages also mislead. A service desk may report an average resolution time of 6 hours for P3 incidents while a fifth of users wait more than two days. Percentiles describe the distribution better: the 50th percentile (median), the 90th percentile and the worst case together tell a fuller story. The program below generates a synthetic month of incident records, then reports, for each priority, the number of incidents, the share resolved within target, the median and the 90th percentile resolution times.
import random, statistics
random.seed(11)

TARGET_H = {1: 4, 2: 8, 3: 27, 4: 45}          # resolution targets in hours (business or calendar)
MEDIAN_H = {1: 2.5, 2: 5.0, 3: 14.0, 4: 22.0}   # typical resolution time by priority
MIX = [1] * 2 + [2] * 8 + [3] * 55 + [4] * 35   # percentage mix of priorities

records = []
for _ in range(1500):
    p = random.choice(MIX)
    hours = random.lognormvariate(0, 0.75) * MEDIAN_H[p]
    records.append((p, hours))

def pct(xs, q):
    xs = sorted(xs)
    k = (len(xs) - 1) * q
    f = int(k)
    c = min(f + 1, len(xs) - 1)
    return xs[f] + (xs[c] - xs[f]) * (k - f)

print(f"{'priority':9}{'count':>6}{'within target':>15}{'median h':>10}{'90th pct h':>12}{'worst h':>9}")
for p in (1, 2, 3, 4):
    hrs = [h for q, h in records if q == p]
    ok = sum(h <= TARGET_H[p] for h in hrs) / len(hrs)
    print(f"P{p:<8}{len(hrs):>6}{ok:>15.1%}{statistics.median(hrs):>10.1f}{pct(hrs, 0.9):>12.1f}{max(hrs):>9.1f}")
all_ok = sum(h <= TARGET_H[p] for p, h in records) / len(records)
print(f"overall within target: {all_ok:.1%}")priority count within target median h 90th pct h worst h P1 31 74.2% 2.5 5.6 21.1 P2 145 75.9% 4.9 11.5 29.6 P3 794 81.1% 14.3 36.7 172.8 P4 530 83.0% 21.5 60.3 213.5 overall within target: 81.1%
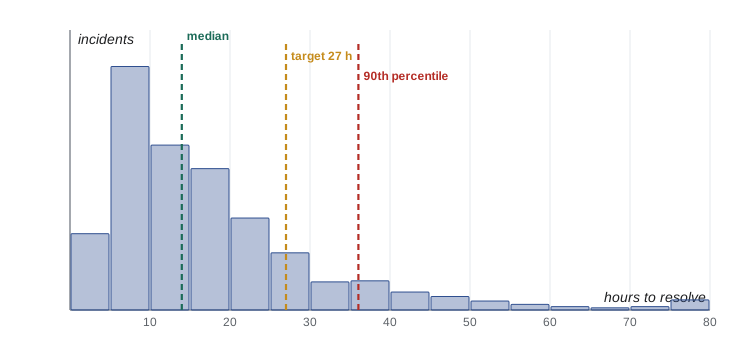
The overall figure looks respectable, but the breakdown shows where the risk lies. If P1 and P2 targets are missed more often than P3 and P4 targets, the most important incidents are getting the worst service relative to their targets, which a single overall number would hide. The 90th percentile and worst case show how long the unluckiest users wait. A good report would add trends over time and a short commentary on the causes of the worst cases.
Staffing for demand
Lesson 2 introduced the effect of shrinkage on service desk staffing. BUS-230 explained the Erlang C model for queues with several servers. Combining the two gives a practical staffing method: forecast contacts per interval, estimate average handling time, use Erlang C to find the agents needed to meet the answer-time target, then divide by one minus shrinkage to find the number to schedule. The program below applies this to a typical day for a service desk that aims to answer 80 % of calls within 30 seconds.
import math

def erlang_c(a, c):
    """Probability of waiting in an M/M/c queue with offered load a erlangs and c agents."""
    if c <= a:
        return 1.0
    top = a ** c / math.factorial(c) * c / (c - a)
    return top / (sum(a ** k / math.factorial(k) for k in range(c)) + top)

def agents_needed(calls_per_hour, aht_min, target_sec=30, goal=0.80):
    a = calls_per_hour * aht_min / 60            # offered load in erlangs
    c = max(1, math.ceil(a))
    while True:
        pw = erlang_c(a, c)
        service_level = 1 - pw * math.exp(-(c - a) * target_sec / (aht_min * 60))
        if service_level >= goal:
            return c, service_level
        c += 1

forecast = {"08:00": 60, "09:00": 140, "10:00": 120, "11:00": 95, "12:00": 70,
            "13:00": 90, "14:00": 85, "15:00": 75, "16:00": 50}
AHT, SHRINK = 7.5, 0.32
print(f"{'hour':6}{'calls':>6}{'on phones':>11}{'service level':>15}{'scheduled':>11}")
for hour, calls in forecast.items():
    c, sl = agents_needed(calls, AHT)
print(f"{hour:6}{calls:>6}{c:>11}{sl:>15.1%}{math.ceil(c / (1 - SHRINK)):>11}")hour calls on phones service level scheduled 08:00 60 11 86.1% 17 09:00 140 22 83.3% 33 10:00 120 19 81.3% 28 11:00 95 16 85.5% 24 12:00 70 12 81.5% 18 13:00 90 15 83.0% 23 14:00 85 14 80.1% 21 15:00 75 13 84.3% 20 16:00 50 9 80.4% 14
The table shows the morning peak needs far more agents than the lunch period or late afternoon, and that the number scheduled is roughly half as much again as the number on the phones because of shrinkage. Real workforce management tools add details such as breaks staggered across intervals, multi-skilled agents, chat concurrency and forecasting from historical patterns, but the logic is the same.
Worked problem
The cost of a target
At 140 calls an hour with a 7.5-minute handling time, a desk needs 22 agents on the phones to answer 80 % of calls within 30 seconds and 24 agents to answer 90 % within 30 seconds. With 32 % shrinkage and a loaded cost of $40 an hour, what does the higher target cost for that hour?
Show solution
- Scheduled for 80 %: 22 ÷ 0.68 ≈ 32.4, so 33 agents.
- Scheduled for 90 %: 24 ÷ 0.68 ≈ 35.3, so 36 agents.
- Extra cost: 3 agents × $40 = $120 for that hour.
- Over a year of similar peak hours, the higher target is a significant budget decision for the business to make knowingly.
Answer: The tighter target costs about $120 more for this peak hour; service level management should agree whether users value the difference enough.
Measuring the user's experience
Operational metrics measure what the provider does. Experience metrics measure how users feel about it. Customer satisfaction (CSAT) asks users to rate a specific interaction, usually on a short scale, immediately after a ticket is resolved. Net Promoter Score (NPS) asks how likely users are to recommend the service on a 0 to 10 scale and subtracts the percentage of detractors (0 to 6) from the percentage of promoters (9 to 10). Customer effort score asks how easy it was to get the issue resolved. Each has limits: response rates are often low, and people who respond may be the happiest or the angriest.
Worked problem
Calculating NPS
After a quarter, 400 users answer the question "How likely are you to recommend IT support to a colleague?" 168 give 9 or 10, 132 give 7 or 8, and 100 give 0 to 6. What is the NPS?
Show solution
- Promoters: 168 ÷ 400 = 42 %.
- Detractors: 100 ÷ 400 = 25 %.
- Passives (7 and 8) are excluded from the calculation.
- NPS = 42 − 25 = +17.
Answer: NPS is +17 on a scale from −100 to +100.
Experience level agreements (XLAs) are a newer idea that complements SLAs. Where an SLA might promise that 90 % of P3 incidents are resolved within 3 business days, an XLA focuses on outcomes and sentiment: for example, that users rate their support experience at least 4 out of 5 on average, that digital workplace issues cost users no more than a set number of lost hours a month, or that new starters are productive on day one. XLAs combine operational data with experience data such as surveys and device telemetry. They encourage providers to fix what matters to users rather than to hit numbers that may not.
| Measure | Focus | Example target |
|---|---|---|
| SLA | Provider performance against agreed targets | 90 % of P2 incidents resolved within 8 hours |
| OLA | Internal team commitments supporting the SLA | Database team responds to escalations within 30 minutes |
| CSAT | Satisfaction with a specific interaction | Average rating of at least 4.3 out of 5 |
| NPS | Overall loyalty or recommendation | NPS of +20 or higher |
| XLA | User outcomes and sentiment | Lost productivity from IT issues under 30 minutes per user per month |
Using measurement to improve
Measurement is worthwhile only if it drives action. ITIL-120's continual improvement model applies directly: understand the vision, assess where you are with data, define where you want to be, plan how to get there, act, check whether you arrived and keep the momentum. In support, this often means a regular service review where service owners, support leaders and customer representatives look at trends, discuss the causes of misses and agree improvement actions. Problem management, knowledge improvement, automation and staffing changes are the usual levers.
Goodhart's law warns that when a measure becomes a target, it ceases to be a good measure. A support team rewarded only for SLA achievement may manipulate clocks; one rewarded only for first contact resolution may avoid escalating when it should. Balanced scorecards, regular sampling of tickets for quality, and a culture where honest reporting is valued more than green dashboards reduce the risk.
Worked problem
From metric to action
A monthly review shows P2 incidents within target fell from 91 % to 78 %. Analysis shows that 60 % of the misses involved the same storage platform and that a supplier escalation took on average 5 hours to get a response. What actions should follow?
Show solution
- Problem management: open a problem for the recurring storage incidents and investigate causes.
- Supplier management: raise the slow response with the supplier and check the underpinning contract targets.
- Incident management: add a runbook and earlier supplier engagement for storage P2s.
- Measure again next month to check whether the actions worked.
Answer: The drop is traced to one platform and one supplier delay, so targeted problem, supplier and runbook actions are more effective than general exhortations to work faster.
Automation and AI in support
Automation now touches every support practice: virtual agents answer questions and log tickets; automated workflows fulfill requests; event management correlates alerts and triggers self-healing; AI models suggest categories and priorities, recommend articles and draft responses; change pipelines run tests and deployments. Organizations report gains in speed and cost, and the most mature use automation to free people for the work that needs judgment and empathy.
Automation also creates new risks. A virtual agent that cannot hand off to a human traps frustrated users. An AI model that misclassifies incidents can route critical issues to the wrong queue. Automated access fulfillment without checks can grant inappropriate permissions. AI-drafted responses can contain confident errors. Good practice is to measure automated outcomes as rigorously as human ones, keep humans accountable, provide easy escalation to people, and review automated decisions that carry risk. Privacy and AI governance rules, which ITIL-150 discusses, are developing quickly in both countries: Canada has no federal AI statute in force as of October 2026, while US rules are a patchwork of federal guidance and state laws.
| Automation | Benefit | Risk to manage |
|---|---|---|
| Virtual agent | Instant answers around the clock | Trapping users who need a person |
| AI ticket classification | Faster routing | Misrouting high-impact incidents |
| Automated request fulfillment | Minutes instead of days | Inappropriate access without checks |
| Event correlation and self-healing | Less noise, faster restoration | Hiding recurring problems |
| AI-drafted responses and articles | Agent productivity | Confident errors, privacy leaks |
Common mistakes
MistakeSetting 100 % targets for incident resolution.
InsteadUse realistic percentage targets and report the worst cases separately.
MistakeReporting only averages.
InsteadReport medians, high percentiles and worst cases by priority.
MistakePausing SLA clocks whenever convenient.
InsteadDefine clear rules for clock pauses and audit samples.
MistakeRelying only on SLAs to judge support.
InsteadCombine SLAs with experience measures such as CSAT, NPS and XLAs.
MistakeAutomating without measuring the results.
InsteadMeasure automated outcomes, keep humans accountable and provide easy escalation.
Summary and key terms
- Service level management sets targets for support practices through SLAs, OLAs and contracts.
- Honest reporting needs clear clock and priority rules; watermelon reporting hides dissatisfaction.
- Percentiles and breakdowns by priority reveal problems that averages hide.
- Erlang C and shrinkage together turn demand forecasts into staffing schedules.
- CSAT, NPS, effort scores and XLAs measure the user's experience.
- Measurement should feed continual improvement, with care to avoid Goodhart's law.
- Automation and AI bring speed and new risks that must be measured and governed.
- Service level agreement (SLA)
- A documented agreement between a provider and a customer that sets service targets.
- Operational level agreement (OLA)
- An agreement between internal teams that supports an SLA.
- Watermelon reporting
- Reports that look green while users are dissatisfied.
- Percentile
- The value below which a given share of observations fall, such as the 90th percentile.
- Erlang C
- A queueing formula giving the probability that an arrival must wait when several agents serve one queue.
- Customer satisfaction (CSAT)
- A rating of satisfaction with a specific interaction.
- Net Promoter Score (NPS)
- The percentage of promoters minus the percentage of detractors on a 0–10 recommendation scale.
- Experience level agreement (XLA)
- An agreement focused on user outcomes and sentiment rather than provider activity.
- Goodhart's law
- When a measure becomes a target, it ceases to be a good measure.
- Service review
- A regular meeting to review service performance and agree improvement actions.
Practice problems
Work each problem on paper first, then reveal the answer to check.
Why are 100 % resolution targets usually a bad idea?
Show answer
One difficult incident breaks them, leaving nothing to aim for, and they encourage gaming.
Give two ways SLA reports can be distorted.
Show answer
Stopping clocks too freely, lowering priorities, closing before confirmation or excluding periods (any two).
Why report the 90th percentile as well as the median?
Show answer
It shows how long the slowest tenth of users wait, which the median hides.
Twenty agents are needed on the phones and shrinkage is 30 %. How many should be scheduled?
Show answer
20 ÷ 0.70 ≈ 28.6, so 29.
Of 250 survey responses, 100 are promoters and 50 detractors. What is the NPS?
Show answer
40 % − 20 % = +20.
How does an XLA differ from an SLA?
Show answer
An XLA focuses on user outcomes and sentiment; an SLA focuses on provider performance targets.
State Goodhart's law.
Show answer
When a measure becomes a target, it ceases to be a good measure.
P2 compliance falls and most misses involve one platform. Name two actions.
Show answer
Open a problem for the platform and review the supplier or runbook for that platform.
Give one risk of a virtual agent.
Show answer
It may trap users who need a human if it cannot hand off.
Why should automated decisions be measured like human ones?
Show answer
Because automation can make errors at scale, such as misrouting or granting wrong access.
Lesson quiz · 5 questions
Score 60% or more to complete this lesson.
Create a free account to save your progress, take quizzes and earn a certificate.