
ITIL-140 · Lesson 9 of 12 · 30 min
Monitoring and event management
Lesson 3 noted that the share of incidents detected by monitoring before users report them is a sign of maturity. This lesson explains how that detection works. In plain words, the purpose of monitoring and event management is to systematically observe services and service components, and to record and report selected changes of state identified as events. Monitoring is the observing; event management is deciding which changes of state matter and what to do about them.
Monitoring and events
Monitoring collects data about services and components: whether they are running, how fast they respond, how much capacity they use, how many errors they produce and whether users can complete key tasks. Monitoring can be passive (collecting data that systems emit, such as logs and metrics) or active (sending test transactions or probes to check behavior). It runs continuously, and most of what it observes is normal and uninteresting.
An event is any change of state that has significance for the management of a service or component. A server starting, a backup completing, a disk passing 80 % full, a certificate due to expire in 14 days and a web page returning errors are all events. Event management decides which changes of state are significant, classifies them, correlates related ones, and triggers the right response: logging, notifying someone, raising an incident or running an automated action.
| Term | Meaning | Example |
|---|---|---|
| Monitoring | Observing services and components continuously | Collecting response times from the web servers every 10 seconds |
| Event | A change of state significant for managing a service | Response time passes 2 seconds |
| Alert | A notification that requires attention | A message to the on-call engineer |
| Threshold | A value at which a metric generates an event | Disk use above 90 % |
| Correlation | Linking related events to a common cause | Fifty application errors traced to one failed database |
Classifying events
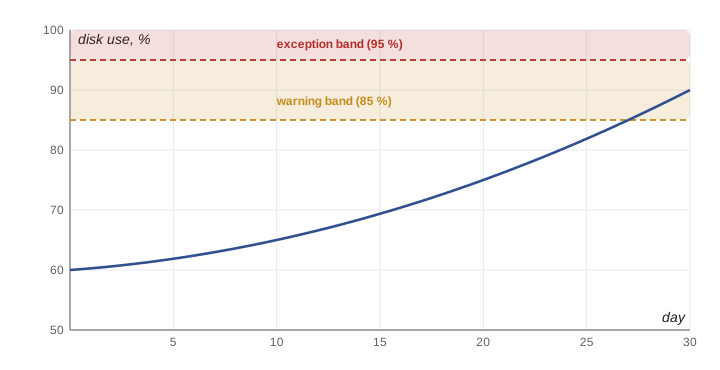
ITIL commonly describes three types of event. Informational events record normal operation, such as a job completing successfully or a user logging in. They need no action but are useful for audit and analysis. Events of the warning type signal that something is unusual but not yet failing, such as a disk at 85 % or response times creeping up. They give a chance to act before users notice. Exception events signal that something has failed or breached a threshold that indicates impact, such as a service down or an error rate far above normal. Exceptions usually raise an incident or trigger an automated response.
Classification is a design decision. The same metric may be informational at one level, a warning at another and an exception at a third. Thresholds should reflect what matters to users and the business, not arbitrary round numbers. A threshold that fires constantly trains people to ignore it; one that fires too late is useless.
| Event type | Meaning | Typical response | Example |
|---|---|---|---|
| Informational | Normal operation, no action needed | Log for analysis and audit | Nightly backup completed in 42 minutes |
| warning | Unusual, could lead to failure | Notify the owning team; create a task or problem if it recurs | Database storage at 85 % and growing 2 % a week |
| Exception | Failure or threshold breach with impact | Raise an incident, page on call or run automated recovery | Checkout API error rate at 12 % for 5 minutes |
Designing thresholds
Good thresholds are tied to impact. For a web service, users care about whether pages load quickly and correctly, so thresholds on response time and error rate for real user requests matter more than CPU usage on a single server. Many organizations now set thresholds based on service level objectives: if the objective is that 99.9 % of requests succeed over 30 days, the error budget is 0.1 % of requests, and alerts fire when the budget is being consumed too quickly. This approach, from site reliability engineering, ties monitoring directly to user experience.
Thresholds can be static (a fixed value) or dynamic (based on normal patterns, such as alerting when traffic is 40 % lower than usual for this hour of the week). Dynamic thresholds catch problems that static ones miss, such as a silent failure that stops orders arriving, but they need enough history and can be confused by legitimate changes in patterns. Combining duration with value also helps: an error rate above 5 % for five minutes is more meaningful than a single spike.
Worked problem
An error budget
A service has an objective that 99.9 % of requests succeed over a rolling 30-day window. It handles about 2 million requests a day. How many failed requests are allowed in 30 days? If a fault causes 1 % of requests to fail, how long would it take to use the whole budget?
Show solution
- Requests in 30 days: 2,000,000 × 30 = 60,000,000.
- Error budget: 0.1 % × 60,000,000 = 60,000 failed requests.
- At 1 % failure: 2,000,000 × 1 % = 20,000 failed requests a day.
- Budget exhausted in 60,000 ÷ 20,000 = 3 days, or about 72 hours.
Answer: 60,000 failures are allowed; a 1 % error rate would use the whole budget in about three days, so it should page someone quickly.
Alert fatigue and noise reduction
One of the biggest risks in monitoring is too many alerts. When on-call engineers receive hundreds of notifications a day, most of them meaningless, they start ignoring them, and the one alert that matters is missed. This is called alert fatigue. It is common after organizations add monitoring tools without designing event management: every tool sends notifications for every threshold, duplicates abound, and one root failure produces a storm of symptoms.
Event management reduces noise in several ways. Deduplication merges repeated identical events into one with a count. Correlation links events with a common cause, for example recognizing that errors from fifty application servers all follow a database failure, and presents one incident instead of fifty. Suppression silences known noise, such as alerts from components in a maintenance window. Enrichment adds context, such as the affected service, owner and recent changes, so the person receiving the alert can act. Routing sends each alert to the team that can act on it. The program below demonstrates deduplication and simple correlation on a synthetic stream of events.
import random
from collections import Counter, defaultdict
random.seed(9)

# Synthetic 10-minute event stream: a database failure at minute 3 triggers app errors
events = []
for minute in range(10):
    events.append((minute, "web-01", "info", "heartbeat ok"))
    if minute >= 3:
        events.append((minute, "db-01", "exception", "database unreachable"))
        for app in ("app-01", "app-02", "app-03", "app-04"):
            for _ in range(random.randint(2, 5)):
                events.append((minute, app, "exception", "db connection refused"))
    if minute in (1, 6):
        events.append((minute, "disk-07", "warning", "disk at 86 percent"))

raw_alerts = [e for e in events if e[2] in ("warning", "exception")]
dedup = Counter((host, sev, msg) for _, host, sev, msg in raw_alerts)
# correlation rule: app errors about db connections belong to the db-01 failure
groups = defaultdict(list)
for (host, sev, msg), n in dedup.items():
    key = "db-01 outage" if host == "db-01" or "db connection" in msg else f"{host}: {msg}"
    groups[key].append((host, n))

print(f"total events: {len(events)}   alerting events: {len(raw_alerts)}")
print(f"after deduplication: {len(dedup)} distinct alerts")
print(f"after correlation:   {len(groups)} incidents or tasks to act on")
for key, members in groups.items():
print(f" {key:22} <- {sum(n for _, n in members)} events from {', '.join(h for h, _ in members)}")total events: 115 alerting events: 105 after deduplication: 6 distinct alerts after correlation: 2 incidents or tasks to act on disk-07: disk at 86 percent <- 2 events from disk-07 db-01 outage <- 103 events from db-01, app-01, app-02, app-03, app-04
In this small example, well over a hundred alerting events become a handful of distinct alerts after deduplication, and correlation reduces them to two things to act on: the database outage and a disk filling up. Real event management platforms use rules, topology from the configuration management system and, increasingly, machine learning to do this at scale. The goal is the same: present people with a small number of meaningful, actionable signals.
Worked problem
Measuring alert noise
An on-call team receives 1,400 alerts in a week. Reviewing them, they find that 1,050 needed no action, 280 were duplicates of real issues and 70 led to useful action. What share of alerts was actionable? What should they do?
Show solution
- Actionable share: 70 ÷ 1,400 = 5 %.
- No-action alerts: 1,050 ÷ 1,400 = 75 %; duplicates: 280 ÷ 1,400 = 20 %.
- Actions: retune or remove thresholds that never need action, add deduplication and correlation, and route informational events to logs instead of pagers.
Answer: Only 5 % of alerts were actionable. Removing no-action alerts and deduplicating could cut volume by up to 95 % while keeping every useful signal.
Synthetic monitoring and observability
Synthetic monitoring runs scripted transactions against a service from outside, as if it were a user: loading the home page, logging in, searching, adding an item to a basket. It detects problems even when no real users are active, such as overnight, and measures the experience from different locations. Real user monitoring complements it by measuring what actual users experience in their browsers or apps.
Observability is a broader idea from modern software operations. A system is observable if its internal state can be understood from its outputs: metrics (numeric measurements over time), logs (records of discrete events) and traces (the path of a request through many services). Observability tools let engineers ask new questions during an incident, such as why requests from one region are slow, without having predicted the question in advance. Monitoring tells you that something is wrong; observability helps you understand why. Published outlines for ITIL (Version 5) mention observability alongside reliability, reflecting this shift.
| Technique | What it observes | Strength |
|---|---|---|
| Infrastructure monitoring | Servers, storage, networks | Early sign of capacity and hardware issues |
| Application performance monitoring | Response times, errors, transactions | Links technical behavior to user experience |
| Synthetic monitoring | Scripted user journeys | Detects failures when no real users are active |
| Real user monitoring | Actual users' experience | Shows what users really see |
| Log analysis | Detailed event records | Supports diagnosis and security investigation |
| Distributed tracing | Requests across many services | Finds where time is spent in complex systems |
Automated responses
Some events can be handled without people. A web server that stops responding can be restarted automatically; a cloud service can add capacity when load rises; a disk can be cleaned of temporary files when it passes a threshold; a certificate can be renewed before it expires. Automated responses reduce restoration time and toil, the repetitive manual work that site reliability engineering seeks to eliminate. They also need care: an automated restart that hides a recurring fault prevents problem management from seeing the pattern, so automated actions should still be logged and counted, and repeated self-healing should raise a problem.
Worked problem
Automating a restart
A service crashes about 25 times a month. Manual restart requires an on-call engineer to respond (average 12 minutes) and restart (3 minutes). An automated health check can detect the crash and restart the service within 1 minute. How much downtime does automation remove each month, and what should problem management do?
Show solution
- Manual downtime: 25 × (12 + 3) = 375 minutes a month.
- Automated downtime: 25 × 1 = 25 minutes a month.
- Downtime removed: 350 minutes, almost 6 hours a month.
- Problem management should still investigate why the service crashes 25 times a month; automation reduces impact but not the cause.
Answer: Automation removes about 350 minutes of downtime a month, but the frequent crashes are a problem that still needs a permanent fix.
People and on-call
Monitoring and event management involve people as well as tools. Someone must decide what to monitor, set and review thresholds, respond to alerts, and maintain the configuration of tools as services change. Many organizations run on-call rotations so that engineers are available outside business hours. On-call is demanding, and poorly designed alerting makes it miserable. Good practice limits the number of pages per shift, reviews every page to ask whether it was necessary, compensates on-call time fairly and in line with employment standards, and gives teams time to fix the causes of noisy alerts. In Canada and the United States, employment standards and collective agreements may govern standby pay and rest periods, so on-call arrangements should be designed with HR.
Connections to other practices
Monitoring and event management feeds incident management (exceptions raise incidents), problem management (event patterns and recurring self-healing reveal problems), capacity and performance management (trends in usage), availability management, service level management (measuring achievement against targets), information security management (security events), change enablement (verifying that changes did not cause harm and detecting unauthorized changes) and service configuration management (discovery of components). It depends on configuration data to understand which service each component supports, so that an event on one server can be linked to the business service it affects.
Common mistakes
MistakeMonitoring everything and alerting on every threshold.
InsteadMonitor widely but alert only on events that need action, tied to user and business impact.
MistakeSetting thresholds at round numbers without considering impact.
InsteadBase thresholds on service level objectives, error budgets and observed behavior.
MistakeSending one alert per symptom during a large failure.
InsteadDeduplicate, correlate and suppress so people see one meaningful incident.
MistakeLetting automated restarts hide recurring faults.
InsteadLog and count automated actions and raise problems for repeated self-healing.
MistakeIgnoring the human cost of on-call.
InsteadLimit and review pages, compensate fairly and give time to remove noisy alerts.
Summary and key terms
- Monitoring and event management observes services and components and records and reports significant changes of state.
- An event is a change of state significant for managing a service; an alert is a notification needing attention.
- Events are commonly classified as informational, warning or exception, each with a different response.
- Thresholds should reflect impact; service level objectives and error budgets tie them to user experience.
- Deduplication, correlation, suppression, enrichment and routing reduce alert fatigue.
- Synthetic and real user monitoring, logs, metrics and traces support detection and observability.
- Automated responses cut restoration time but should still feed problem management.
- Monitoring and event management
- The practice of observing services and components and recording and reporting significant changes of state.
- Event
- Any change of state that has significance for the management of a service or component.
- Alert
- A notification that a significant event requires attention.
- Threshold
- A value of a metric at which an event is generated.
- Correlation
- Linking related events to a common cause.
- Deduplication
- Merging repeated identical events into one with a count.
- Alert fatigue
- Desensitization caused by too many alerts, leading to important ones being missed.
- Error budget
- The amount of failure allowed by a service level objective over a period.
- Synthetic monitoring
- Running scripted transactions against a service to test it as a user would.
- Observability
- The ability to understand a system's internal state from its metrics, logs and traces.
Practice problems
Work each problem on paper first, then reveal the answer to check.
State the purpose of monitoring and event management in plain words.
Show answer
To observe services and components systematically and record and report significant changes of state.
What is the difference between monitoring and an event?
Show answer
Monitoring is continuous observation; an event is a significant change of state it detects.
Classify: a backup completed successfully.
Show answer
Informational.
Classify: the payment API has failed for all users.
Show answer
Exception.
A service handles 500,000 requests a day with a 99.5 % objective over 30 days. What is the error budget?
Show answer
0.5 % × 15,000,000 = 75,000 failed requests.
Of 900 weekly alerts, 63 were actionable. What share is that?
Show answer
7 %.
Name three techniques that reduce alert noise.
Show answer
Any three of: deduplication, correlation, suppression, enrichment, routing, retuning thresholds.
What does synthetic monitoring detect that real user monitoring cannot?
Show answer
Failures when no real users are active, such as overnight.
Why should automated restarts be counted?
Show answer
So recurring faults are visible to problem management instead of being hidden.
Name the three main types of observability data.
Show answer
Metrics, logs and traces.
Lesson quiz · 5 questions
Score 60% or more to complete this lesson.
Create a free account to save your progress, take quizzes and earn a certificate.