
ROB-430 · Lesson 8 of 12 · 32 min
Designing HRI user studies
Much of what we know about human-robot interaction comes from user studies: experiments and field observations in which people interact with robots and researchers measure what happens. Designing a good study is a skill in its own right. A study that is poorly designed can produce confident conclusions that are simply wrong, waste participants' time and, in the worst cases, expose them to risk without benefit. This lesson covers how to turn a design question into a testable hypothesis, how to choose between study designs, how to control confounds, how to use standard questionnaires such as Godspeed, the NASA-TLX and the System Usability Scale, how to plan sample sizes, and how research ethics review works in Canada and the United States. Lesson 9 then covers how to analyze the data.
From question to hypothesis
A study starts with a question: does a robot that signals its intended path with a floor projection make bystanders feel safer than one that uses only a light ring? To test it, the question becomes a hypothesis with defined variables. The independent variable is what the researcher manipulates: the signaling method, with two levels, projection and light ring. Dependent variables are what is measured: perceived safety on a validated scale, how far people step aside, and how long they hesitate. Confounding variables are anything else that differs between conditions and could explain the result, such as the time of day, the experimenter's behavior or the robot's speed. A good hypothesis is specific and falsifiable: participants will rate perceived safety higher and hesitate less with the floor projection than with the light ring.
Researchers should state hypotheses and analysis plans before collecting data. Preregistration, publishing the hypotheses, design, sample size and analysis plan in a time-stamped public registry such as the Open Science Framework, helps separate confirmatory tests from exploratory findings and reduces the risk of reporting only the analyses that happened to work. Lesson 9 explains why this matters, in the context of the replication crisis.
Study designs
In a between-subjects design, each participant experiences only one condition. Different groups are compared. This avoids carry-over effects, where experiencing one condition changes how people respond to the next, but needs more participants, because differences between people add noise. In a within-subjects design, also called repeated measures, each participant experiences every condition, and each person serves as their own comparison. This needs fewer participants and is more sensitive, but introduces order effects: people get better with practice, get tired or bored, or learn about the robot in the first condition. Mixed designs combine both, for example comparing two robot designs between subjects while measuring each participant across three sessions.
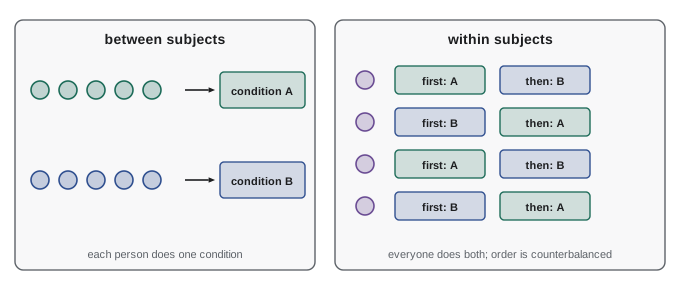
Order effects in within-subjects designs are handled by counterbalancing: varying the order of conditions across participants so that each condition appears equally often in each position. With two conditions, half the participants get AB and half BA. With more conditions, complete counterbalancing becomes impractical (four conditions have 24 orders), so researchers use a Latin square, in which each condition appears once in each position, and a balanced Latin square, in which each condition also follows every other condition equally often.
Worked problem
A balanced Latin square for four conditions
A study compares four robot speed settings, A to D, within subjects. Construct a balanced Latin square and state how many participants are needed for complete balance.
Show solution
- For an even number of conditions, the first row follows the pattern 1, 2, n, 3, n-1, ...: A, B, D, C.
- Each subsequent row adds one to every entry, wrapping around: B, C, A, D; then C, D, B, A; then D, A, C, B.
- Check: each condition appears once in each position, and each condition immediately follows every other condition exactly once.
- Participants should be assigned in multiples of four so each row is used equally.
Answer: Rows ABDC, BCAD, CDBA and DACB, with participants in multiples of four, for example 24 or 28.
| Design choice | Advantages | Disadvantages | Good for |
|---|---|---|---|
| Between subjects | No carry-over; simple | Needs more participants; individual differences add noise | First impressions, deception, learning effects |
| Within subjects | Fewer participants; more sensitive | Order, fatigue and learning effects; needs counterbalancing | Comparing interface variants, speeds, signals |
| Laboratory study | Control over conditions | Artificial setting; may not generalize | Isolating specific effects |
| Field study | Realistic use and context | Less control; harder to measure | Acceptance, long-term use, social effects |
| Video or online study | Large, diverse samples cheaply | No physical presence; may not reflect live interaction | Early screening of designs |
| Wizard of Oz | Tests interactions before autonomy exists | Wizard variability; deception issues | Dialogue and social behavior design |
Wizard of Oz studies deserve special mention. In them, a hidden human operator, the wizard, controls part or all of the robot's behavior while participants believe it is autonomous. Laurel Riek's 2012 review of Wizard of Oz studies in HRI found that many papers reported little about the wizard's training, constraints or error rates, making results hard to interpret or replicate. Good practice is to script the wizard's options, train and measure wizard consistency, report the wizard's role clearly, and debrief participants about the deception afterwards. Video-based studies, in which participants watch recordings of robots, are cheap and scalable, but research comparing live and video presentation suggests that physical presence can change responses, so findings should be checked in live interaction before strong conclusions are drawn.
Participants and sampling
Many HRI studies recruit university students because they are convenient. Such samples tend to be young, educated and familiar with technology, and results may not generalize to older adults, workers, children or people with disabilities. Psychologists have criticized reliance on WEIRD samples (Western, educated, industrialized, rich and democratic) for drawing conclusions about humans in general. Studies should recruit participants who resemble the people who will actually use the robot, report demographics clearly, and avoid claiming more generality than the sample supports. Inclusion criteria, exclusion criteria and the recruitment method should be decided in advance.
Standard measures
Questionnaires should be validated: developed and tested to show they measure what they claim, reliably. Making up new items for each study makes results impossible to compare and of unknown quality. Three instruments are especially common in HRI.
The Godspeed questionnaire series, published by Christoph Bartneck, Dana Kulić, Elizabeth Croft and Susana Zoghbi in 2009, measures five concepts with semantic differential items, pairs of opposite adjectives rated on five-point scales: anthropomorphism (for example fake to natural), animacy (dead to alive), likeability (dislike to like), perceived intelligence (incompetent to competent) and perceived safety (anxious to relaxed). It is widely used and convenient, but later work has questioned some of its psychometric properties, such as overlap between scales, and the Robotic Social Attributes Scale, RoSAS, developed by Colleen Carpinella and colleagues in 2017, offers an alternative measuring warmth, competence and discomfort. Researchers should report reliability, such as Cronbach's alpha, for each scale in their own data.
The NASA-TLX, introduced in lesson 2, measures workload. The System Usability Scale, SUS, created by John Brooke in 1986 and published in 1996, is a ten-item questionnaire with five-point agreement scales, alternating positive statements (odd items, such as "I thought the system was easy to use") and negative statements (even items, such as "I found the system unnecessarily complex"). Its scoring converts responses to a 0 to 100 scale:
A SUS score is not a percentage. Benchmark data compiled by Jeff Sauro and James Lewis put the average across many products at about 68, so a score of 68 is roughly the 50th percentile, and scores above about 80 are in the top tenth or so. SUS is quick and robust even with small samples, but it measures perceived usability overall and does not diagnose specific problems, which needs observation and interviews.
Worked problem
Scoring the System Usability Scale
A participant rates a robot programming interface on the ten SUS items as 4, 2, 4, 1, 5, 2, 4, 2, 3, 3. Compute the SUS score.
Show solution
- Odd items (1, 3, 5, 7, 9): responses 4, 4, 5, 4, 3; contributions \( r - 1 \) = 3, 3, 4, 3, 2; sum 15.
- Even items (2, 4, 6, 8, 10): responses 2, 1, 2, 2, 3; contributions \( 5 - r \) = 3, 4, 3, 3, 2; sum 15.
- Total: \( 15 + 15 = 30 \); SUS \( = 2.5 \times 30 = 75 \).
Answer: A SUS score of 75, above the commonly cited average of about 68.
# SUS scoring for a group and a comparison with the benchmark average of about 68
import numpy as np
rng = np.random.default_rng(430)
def sus(r):
    r = np.asarray(r)
    return 2.5 * ((r[:, 0::2] - 1).sum(axis=1) + (5 - r[:, 1::2]).sum(axis=1))
odd = np.clip(np.round(rng.normal(3.9, 0.7, (12, 5))), 1, 5)
even = np.clip(np.round(rng.normal(2.1, 0.7, (12, 5))), 1, 5)
resp = np.empty((12, 10)); resp[:, 0::2] = odd; resp[:, 1::2] = even
scores = sus(resp)
print("first participant responses:", resp[0].astype(int))
print("scores:", scores)
print(f"mean {scores.mean():.1f}, sd {scores.std(ddof=1):.1f}, share above 68: {np.mean(scores > 68):.0%}")first participant responses: [5 2 4 1 5 3 4 2 3 1] scores: [80. 70. 77.5 77.5 77.5 80. 72.5 65. 70. 80. 75. 77.5] mean 75.2, sd 4.8, share above 68: 92%
Planning sample size
A study needs enough participants to detect the effect it is looking for. Statistical power is the probability that a study will detect an effect of a given size if it exists, usually set at 0.80 or higher at a significance level of 0.05. Effect size is often expressed as Cohen's \( d \), the difference in means divided by the standard deviation; values of about 0.2, 0.5 and 0.8 are conventionally called small, medium and large, though what counts as meaningful depends on the field. Many HRI studies have been underpowered, with samples of 10 to 30 participants that can only reliably detect large effects.
For a within-subjects comparison of two conditions analyzed with a paired t-test, what matters is the effect size of the differences, \( d_z \), the mean difference divided by the standard deviation of the differences. If the standard deviation in each condition is \( \sigma \) and the correlation between a person's scores in the two conditions is \( \rho \), then \( d_z = d / \sqrt{2(1 - \rho)} \). A high correlation, common when people differ consistently from each other, makes within-subjects designs much more efficient. A normal approximation gives the number of participants:
Worked problem
Sample size for a within-subjects study
You expect a robot speed change to shift perceived safety by \( d = 0.5 \) and expect a correlation of \( \rho = 0.6 \) between each person's ratings in the two conditions. How many participants are needed for 80 percent power at a two-sided 0.05 level? How many for a between-subjects design?
Show solution
- \( d_z = 0.5/\sqrt{2(1 - 0.6)} = 0.5/0.894 \approx 0.56 \).
- Within: \( n \approx (2.80/0.56)^2 + 1.92 \approx 25.0 + 1.9 \approx 27 \) participants.
- Between: each group needs about \( 2(2.80/0.5)^2 \approx 63 \), so about 126 in total (64 per group with the small-sample correction).
Answer: About 27 participants within subjects versus roughly 128 between subjects, which is why within-subjects designs are popular when carry-over is not a problem.
# Power of a paired t-test by simulation, compared with the normal approximation
import numpy as np
rng = np.random.default_rng(430)
def power_sim(n, d=0.5, rho=0.6, reps=4000):
    cov = [[1, rho], [rho, 1]]
    null = []; alt = []
    for _ in range(reps):
        x = rng.multivariate_normal([0, 0], cov, n); diff = x[:, 1] - x[:, 0]
        null.append(diff.mean() / (diff.std(ddof=1) / np.sqrt(n)))
        y = rng.multivariate_normal([0, d], cov, n); diff = y[:, 1] - y[:, 0]
        alt.append(diff.mean() / (diff.std(ddof=1) / np.sqrt(n)))
    crit = np.quantile(np.abs(null), 0.95)              # two-sided 0.05 critical value
    return np.mean(np.abs(alt) > crit), crit
dz = 0.5 / np.sqrt(2 * (1 - 0.6))
n_approx = ((1.96 + 0.84) / dz) ** 2 + 1.96 ** 2 / 2
print(f"d_z = {dz:.3f}, approximate n = {n_approx:.1f}")
for n in (12, 20, 27, 35):
    p, c = power_sim(n)
print(f"n = {n:2d}: simulated power {p:.2f} (critical |t| {c:.2f})")d_z = 0.559, approximate n = 27.0 n = 12: simulated power 0.40 (critical |t| 2.24) n = 20: simulated power 0.66 (critical |t| 2.05) n = 27: simulated power 0.82 (critical |t| 2.04) n = 35: simulated power 0.90 (critical |t| 2.02)
Research ethics review
Research involving people must be reviewed for ethics before it begins. HRI studies may seem harmless, but they can involve physical risk from robots, deception in Wizard of Oz designs, video recording of identifiable people, data from vulnerable groups such as children or people with dementia, and stress or embarrassment. Ethics review protects participants and researchers, and journals and conferences increasingly require authors to state that their studies were approved.
In the United States, federally funded research involving human subjects must follow the Federal Policy for the Protection of Human Subjects, known as the Common Rule, codified for the Department of Health and Human Services at 45 CFR 46, with major revisions that took effect in 2018 and 2019. Its ethical foundation is the 1979 Belmont Report, with three principles: respect for persons, beneficence and justice. Studies are reviewed by an Institutional Review Board, or IRB. Some minimal-risk research, such as certain surveys, interviews and benign behavioral interventions, falls into exempt categories, but the institution, not the researcher, normally makes that determination. Informed consent must present key information first, and deception requires justification and usually debriefing. Many universities apply the same standards to research that is not federally funded. The Canadian counterpart is TCPS 2 (2022), with review by Research Ethics Boards.
| Topic | Canada | United States |
|---|---|---|
| Governing framework | TCPS 2 (2022), Tri-Council Policy Statement | Common Rule, 45 CFR 46 (revised 2018) |
| Review body | Research Ethics Board (REB) | Institutional Review Board (IRB) |
| Core principles | Respect for persons, concern for welfare, justice | Respect for persons, beneficence, justice (Belmont Report) |
| Minimal-risk route | Delegated review, proportionate to risk | Exempt categories or expedited review |
| Deception | Allowed when justified, with debriefing | Allowed when justified, usually with debriefing |
| Indigenous research | Chapter 9: engagement with First Nations, Inuit and Métis communities | Tribal research review may apply; not part of the Common Rule itself |
For an HRI study, the ethics application typically describes the robot and its safety measures, the risk assessment (lesson 4), recruitment, consent forms, any deception and debriefing, data handling and retention, video recording and its use in publications, and how participants can withdraw. Privacy law (lesson 11) also governs how personal information is collected and stored. Planning these details early often improves the study design itself.
Common mistakes
MistakeDesigning a questionnaire from scratch for every study.
InsteadUse validated instruments such as Godspeed, RoSAS, NASA-TLX and SUS, and report their reliability.
MistakeRunning a within-subjects study with all participants in the same order.
InsteadCounterbalance with complete orders or a balanced Latin square.
MistakeTreating a SUS score of 70 as 70 percent usable.
InsteadSUS is not a percentage; compare with benchmarks such as the average of about 68.
MistakeChoosing a sample size by convention, such as 20 participants.
InsteadCompute sample size from the expected effect size and design, and preregister it.
MistakeUsing Wizard of Oz without reporting the wizard's role or debriefing.
InsteadScript and report the wizard's behavior, and debrief participants as ethics review requires.
Summary and key terms
- A study tests a specific hypothesis with defined independent, dependent and confounding variables.
- Between-subjects designs avoid carry-over; within-subjects designs need fewer participants but need counterbalancing.
- Wizard of Oz and video studies are useful but must be reported carefully and checked against live interaction.
- Godspeed, NASA-TLX and SUS are standard validated measures; SUS averages about 68 across products.
- Power analysis sets sample size; within-subjects designs gain efficiency when scores are correlated.
- Canada uses TCPS 2 (2022) and REBs; the United States uses the Common Rule, 45 CFR 46, and IRBs.
- Preregistration separates confirmatory tests from exploration.
- Independent variable
- The factor a researcher manipulates.
- Dependent variable
- The outcome a researcher measures.
- Confound
- A variable that differs between conditions and could explain the result.
- Counterbalancing
- Varying condition order across participants to cancel order effects.
- Wizard of Oz
- A method in which a hidden person controls a robot that participants think is autonomous.
- Godspeed questionnaire
- Five scales measuring anthropomorphism, animacy, likeability, perceived intelligence and perceived safety.
- System Usability Scale
- A ten-item questionnaire giving a 0 to 100 usability score.
- Statistical power
- The probability of detecting an effect of a given size if it exists.
- Preregistration
- Publishing hypotheses and analysis plans before collecting data.
- Research ethics board
- A committee that reviews research involving people; REB in Canada, IRB in the United States.
Practice problems
Work each problem on paper first, then reveal the answer to check.
Name the five Godspeed concepts.
Show answer
Anthropomorphism, animacy, likeability, perceived intelligence and perceived safety.
SUS responses all 3: score?
Show answer
\( 2.5 \times (5 \times 2 + 5 \times 2) = 50 \).
How many complete orders exist for 4 conditions?
Show answer
24.
Give one advantage and one disadvantage of a within-subjects design.
Show answer
Fewer participants and more sensitivity; order and carry-over effects.
\( d = 0.4 \), \( \rho = 0.5 \): what is \( d_z \)?
Show answer
\( 0.4/\sqrt{1} = 0.4 \).
Approximate n for \( d_z = 0.4 \) at 80 percent power?
Show answer
\( (2.8/0.4)^2 + 1.9 \approx 51 \).
What are the three core principles of TCPS 2?
Show answer
Respect for persons, concern for welfare and justice.
What document underlies the US Common Rule's principles?
Show answer
The Belmont Report.
Why debrief after a Wizard of Oz study?
Show answer
Participants were deceived about autonomy and must be told the truth.
What is a WEIRD sample?
Show answer
Western, educated, industrialized, rich and democratic participants.
Lesson quiz · 5 questions
Score 60% or more to complete this lesson.
Create a free account to save your progress, take quizzes and earn a certificate.