
ROB-499 · Lesson 3 of 12 · 28 min
Concept generation and trade studies
With requirements agreed, a team is tempted to build the first design that comes to mind. Experienced engineers resist that temptation for a few days. Generating several genuinely different concepts and comparing them systematically catches fatal flaws early, when changing direction costs a sketch rather than a rebuilt chassis. This lesson covers how to generate concepts, how to organize them with functional decomposition and morphological charts, how to screen them, and how to run a trade study with a weighted decision matrix whose result is robust to the weights you chose. It ends with feasibility checks and early prototypes that reduce the biggest unknowns.
Functional decomposition
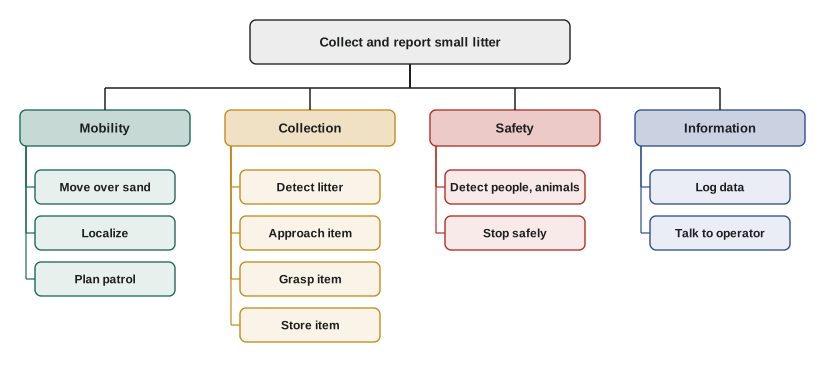
Before generating solutions, break the system into the functions it must perform, independent of how they will be done. For Tern the top-level function is "collect and report small litter on the upper beach". It decomposes into move over sand, localize, plan a patrol, detect litter, approach an item, grasp the item, store the item, detect people and animals, stop safely, log data and communicate with the operator. Each function can then be considered separately. Decomposing by function rather than by component is important: "grasp the item" invites options such as a gripper, a scoop, a vacuum, a rotating brush or a spike, whereas "design the arm" has already assumed an arm.
Generating concepts
Concept generation draws on several sources. Benchmarking looks at existing products and research robots: beach-cleaning machines, litter-picking research platforms, agricultural weeders and warehouse pickers solve related problems. Patent and literature searches reveal mechanisms you might not invent yourself. Brainstorming within the team, with rules such as no criticism during generation and building on others' ideas, produces quantity; methods such as brainwriting, where each member sketches ideas silently before sharing, reduce the dominance of the loudest voice. Analogies help: a heron picks small objects from sand with a beak; a claw machine grasps with three fingers from above; a street sweeper uses rotating brushes.
A morphological chart organizes the options. Each row is a function and each column holds alternative means of achieving it. A concept is one path through the chart, choosing one option per row. Even a small chart produces many combinations, so the team selects a handful of coherent concepts that differ meaningfully rather than evaluating every combination.
| Function | Option A | Option B | Option C | Option D |
|---|---|---|---|---|
| Move over sand | Four wide wheels, skid steer | Tracks | Two wheels and caster | Legged |
| Grasp item | Two-finger gripper on arm | Scoop and sieve | Vacuum nozzle | Rotating brush into bin |
| Detect litter | RGB camera with neural detector | Depth camera plus color | Thermal camera | Human spotter with tablet |
| Localize | RTK GNSS | Lidar against boardwalk features | Wheel odometry and IMU only | Visual markers on posts |
| Detect people | Safety-rated 2D lidar scanner | Depth camera person detector | Bumper only | Ultrasonic ring |
From this chart, Team Tern defined four concepts. Concept 1, the picker, used four wide wheels, a small arm with a two-finger gripper, an RGB-D camera and RTK GNSS. Concept 2, the sifter, used tracks and a scoop with a vibrating sieve that would collect items with sand and shake the sand out. Concept 3, the sweeper, used wheels and a front rotating brush feeding a bin. Concept 4, the spotter, had no collection mechanism at all: a small, fast robot would map litter and guide staff to it with a phone app. Concept 4 was included deliberately as a low-risk alternative that still met need N2 and part of N1.
Screening concepts
Before detailed comparison, a quick screen removes concepts that fail a must-have requirement or a hard constraint. Pugh's method compares each concept with a reference, often the simplest credible design or an existing solution, criterion by criterion, marking each as better (+), the same (S) or worse (-). It is fast and encourages discussion, and it often suggests hybrids that combine the strengths of several concepts. Team Tern used the spotter as the reference. The sweeper scored poorly on bird safety and on dune vegetation damage and was dropped; the parks staff also pointed out that brushes collect large amounts of seaweed, which is ecologically valuable on beaches and should be left in place.
The weighted decision matrix
For the remaining concepts, a weighted decision matrix gives a more careful comparison. The team lists criteria derived from the requirements, assigns each a weight reflecting its importance, scores each concept on each criterion on a fixed scale, often 1 to 5 with written anchors for each score, and multiplies and sums. Weights should be agreed before scoring, ideally with the partner, so that they are not adjusted afterwards to favor a preferred concept. Pairwise comparison, in which each criterion is compared with every other and the number of wins determines its weight, is a simple way to reach agreement.
Scores must be justified. "Picker scores 4 on collection performance" should be backed by evidence, such as a quick test, a datasheet, a published result or a calculation. Anchors make scoring consistent: for grasp success, 5 might mean "expected above 80 % on target items, demonstrated in a quick test", and 1 might mean "expected below 30 % or untested principle". Where evidence is weak, the team records the uncertainty and treats the score as a risk to reduce with an early prototype.
| Criterion | Weight | Picker | Sifter | Spotter |
|---|---|---|---|---|
| Collection performance on target items | 0.25 | 4 | 4 | 1 |
| Safety around people and birds | 0.20 | 4 | 3 | 5 |
| Technical risk within one term | 0.20 | 2 | 2 | 5 |
| Data and reporting value | 0.10 | 4 | 3 | 5 |
| Cost within budget | 0.10 | 3 | 2 | 5 |
| Maintainability by parks staff | 0.10 | 3 | 2 | 4 |
| Minimal environmental impact on sand and wrack | 0.05 | 4 | 2 | 5 |
| Weighted total | 1.00 | 3.40 | 2.80 | 3.90 |
The spotter wins, which surprised the team. Its advantage comes almost entirely from low technical risk and high safety; it scores poorly on collection, the core of need N1. This is exactly the situation where a decision matrix should start a conversation rather than end it. The team asked the partner whether a robot that only found litter would be valuable. The parks manager said that mapping alone would not reduce staff hours enough to justify the project. That is new information about the weights: collection performance mattered more than the team had assumed.
Sensitivity analysis
Because weights and scores are judgments, a responsible trade study checks how sensitive the result is to them. The simplest check is to vary one weight at a time and see where the ranking changes. A more thorough check perturbs all the weights randomly, many times, and counts how often each concept wins. If the winner changes with small, plausible changes to the weights, the decision is not robust, and the team should gather better evidence or consider a hybrid.
# Trade study: weighted totals and Monte Carlo sensitivity to the weights
import numpy as np
rng = np.random.default_rng(499)
criteria = ["collection", "safety", "tech risk", "data", "cost", "maintain", "environment"]
w0 = np.array([0.25, 0.20, 0.20, 0.10, 0.10, 0.10, 0.05])
S = {"Picker": [4, 4, 2, 4, 3, 3, 4], "Sifter": [4, 3, 2, 3, 2, 2, 2], "Spotter": [1, 5, 5, 5, 5, 4, 5]}
names = list(S); M = np.array([S[n] for n in names], float)
print("baseline totals:", dict(zip(names, np.round(M @ w0, 2))))
# one-at-a-time: collection weight needed for Picker to beat Spotter
for wc in np.arange(0.25, 0.61, 0.05):
    w = w0.copy(); w[0] = wc; w[1:] = w0[1:] * (1 - wc) / w0[1:].sum()
    t = M @ w
    print(f"collection weight {wc:.2f}: winner {names[int(t.argmax())]:7s} totals {np.round(t, 2)}")
# Monte Carlo: Dirichlet weights scattered around the agreed weights
wins = dict.fromkeys(names, 0)
for _ in range(10000):
    w = rng.dirichlet(w0 * 40)
    wins[names[int((M @ w).argmax())]] += 1
print("share of wins:", {n: f"{c/100:.1f} %" for n, c in wins.items()})baseline totals: {'Picker': np.float64(3.4), 'Sifter': np.float64(2.8), 'Spotter': np.float64(3.9)}
collection weight 0.25: winner Spotter totals [3.4 2.8 3.9]
collection weight 0.30: winner Spotter totals [3.44 2.88 3.71]
collection weight 0.35: winner Spotter totals [3.48 2.96 3.51]
collection weight 0.40: winner Picker totals [3.52 3.04 3.32]
collection weight 0.45: winner Picker totals [3.56 3.12 3.13]
collection weight 0.50: winner Picker totals [3.6 3.2 2.93]
collection weight 0.55: winner Picker totals [3.64 3.28 2.74]
collection weight 0.60: winner Picker totals [3.68 3.36 2.55]
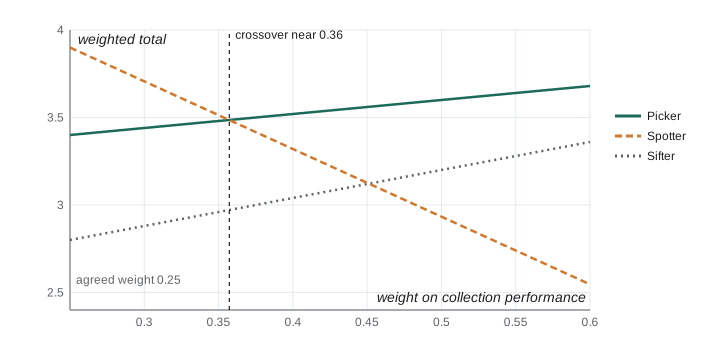
share of wins: {'Picker': '7.0 %', 'Sifter': '0.0 %', 'Spotter': '93.0 %'}The one-at-a-time sweep shows that the picker overtakes the spotter only when collection weight rises to between 0.35 and 0.40 (about 0.36 by interpolation), well above the agreed 0.25, with the other weights scaled down in proportion. The Monte Carlo run, in which weights vary randomly around the agreed values, shows the spotter winning in about 93 percent of trials. In other words, with the original weights the spotter is a robust winner; the decision changes only if the team and partner genuinely believe collection matters far more than first agreed. After the partner conversation, the team did not simply raise the weight until the picker won, which would have been manipulating the analysis. Instead they reframed the decision as a hybrid.
Hybrids and staged concepts
Many good capstone designs are hybrids that reduce risk by staging capability. Team Tern chose a picker built on a spotter: the mobile base, localization, detection, safety and logging would be built and tested first, which on its own delivers the spotter's value and satisfies need N2. The arm and gripper would be developed in parallel and integrated in the second half of term, delivering collection if it worked. If grasping failed to reach its target, the team would still have a working, safe, data-gathering robot and could demonstrate grasping as a partial result. This staging turned the technical-risk criterion from a weakness of the picker into a manageable plan, and it is a pattern worth copying: design so that the system is useful at several levels of completion.
Worked problem
Checking a concept against a hard constraint
The sifter concept needs a scoop 40 cm wide that lifts about 5 cm of sand. Dry sand has a bulk density of about 1,600 kg/m\(^3\). If the scoop advances 30 cm per cycle, what mass of sand does it lift per cycle, and is that compatible with a robot limited to 25 kg?
Show solution
- Volume per cycle: \( 0.40 \times 0.05 \times 0.30 = 0.006 \) m\(^3\).
- Mass per cycle: \( 0.006 \times 1600 = 9.6 \) kg.
- Lifting and shaking nearly 10 kg of sand each cycle requires large actuators and a heavy, stable base, and the reaction forces would tip or slide a 25 kg robot on soft sand.
- The sifter therefore conflicts with the mass constraint unless the scoop is made much smaller, which would hurt coverage.
Answer: About 9.6 kg per cycle, incompatible with a 25 kg robot; a quick calculation like this can eliminate a concept before any hardware is built.
Feasibility checks and early prototypes
Trade studies rest on assumptions, so the biggest uncertainties should be tested before the design is committed. Useful early checks include quick calculations, such as the sand mass above or a wheel sinkage estimate from ROB-460 lesson 2; borrowing or buying a component and testing it in the real environment; and building a crude "looks-like" or "works-like" prototype. Team Tern spent two afternoons in week 3 on the beach with a borrowed depth camera and a hobby gripper on a broom handle. They learned that wet sand clumps around cans, that bright sun washes out the infrared depth image at midday, and that a two-finger gripper picks up cans well but struggles with flat wrappers. All three findings changed requirements or design choices: patrols moved to morning and late afternoon, the detector relied more on color images than depth, and wrappers stayed a should-have.
These quick prototypes are sometimes called spikes in agile software practice: short, time-boxed investigations that answer one question. The key discipline is to define the question and the time limit beforehand, for example "Can the borrowed camera detect cans at 3 m in morning light? Two hours.", and to record the answer, even if it is no. A failed spike in week 3 is cheap; the same discovery in week 10 can sink a project.
When benchmarking existing solutions, search patent databases as well as products. The USPTO's Patent Public Search tool and international databases such as WIPO's PATENTSCOPE are free to search; lesson 11 explains why a design you build for a capstone could also have intellectual property implications.
Finally, document the trade study in the requirements and concept review package: the functional decomposition, the morphological chart, the concepts considered, the screening, the decision matrix with weights and evidence, the sensitivity analysis and the decision with its rationale. Examiners use this to judge whether the chosen design was reasoned or assumed. A well-documented decision that later proves wrong is still good engineering; an undocumented decision that happens to work is luck.
Common mistakes
MistakeDeveloping only one concept and calling it a trade study.
InsteadGenerate several genuinely different concepts, including a low-risk alternative, before comparing.
MistakeDecomposing the system by components such as arm, base and camera.
InsteadDecompose by function so that alternatives for each function stay open.
MistakeAdjusting weights after scoring until the preferred concept wins.
InsteadAgree weights before scoring, justify them with stakeholders and use sensitivity analysis to test robustness.
MistakeScoring concepts from intuition alone.
InsteadUse anchored scales and back each score with a calculation, datasheet, test or published result.
MistakeTreating the matrix total as the decision.
InsteadUse the matrix to structure discussion; investigate surprises and consider hybrids or staged designs.
MistakeSkipping early prototypes because hardware takes time.
InsteadRun short, time-boxed spikes on the biggest unknowns in the real environment before committing.
Summary and key terms
- Functional decomposition breaks the system into solution-independent functions so that alternatives stay open.
- Benchmarking, literature and patent searches, brainstorming, brainwriting and analogies generate concepts.
- A morphological chart lists options per function; concepts are coherent paths through it.
- Pugh screening against a reference quickly removes weak concepts and suggests hybrids.
- A weighted decision matrix with agreed weights and anchored, evidenced scores compares the remaining concepts.
- Sensitivity analysis, one weight at a time or Monte Carlo, shows whether the decision is robust.
- Staged or hybrid designs that are useful at several levels of completion reduce risk; spikes test the biggest unknowns early.
- Functional decomposition
- Breaking a system's overall function into sub-functions independent of how they are implemented.
- Morphological chart
- A table listing alternative means for each function, from which concepts are assembled.
- Benchmarking
- Studying existing products, research and patents that address similar problems.
- Pugh matrix
- A screening method comparing concepts against a reference as better, same or worse on each criterion.
- Weighted decision matrix
- A table scoring concepts on weighted criteria and summing to compare them.
- Anchored scale
- A scoring scale with written descriptions for each score level to make scoring consistent.
- Sensitivity analysis
- Testing how a result changes when inputs such as weights or scores vary.
- Hybrid concept
- A design combining strengths of several concepts.
- Spike
- A short, time-boxed investigation that answers one specific technical question.
- Works-like prototype
- An early prototype built to test function rather than appearance.
Practice problems
Work each problem on paper first, then reveal the answer to check.
Decompose the function "store the item" into two or three sub-functions.
Show answer
For example: transfer the item from the gripper to the bin, retain it when the robot moves, and indicate when the bin is full.
Why include a deliberately low-risk concept such as the spotter?
Show answer
It provides a fallback, sets a reference for comparison and shows whether the added risk of more ambitious concepts is justified.
A morphological chart has 5 functions with 4 options each. How many combinations exist?
Show answer
\( 4^5 = 1024 \), which is why teams select a few coherent concepts rather than evaluating all combinations.
What is the main advantage of Pugh screening over a full weighted matrix?
Show answer
It is quick, encourages discussion and identifies hybrids before effort is spent on detailed scoring.
Explain why weights should be agreed before scoring.
Show answer
To prevent bias in which weights are adjusted to favor a preferred concept after the scores are known.
Using the table, recompute the picker's total if collection weight becomes 0.40 and technical risk 0.05, other weights unchanged.
Show answer
\( 0.40(4)+0.20(4)+0.05(2)+0.10(4)+0.10(3)+0.10(3)+0.05(4) = 1.6+0.8+0.1+0.4+0.3+0.3+0.2 = 3.70 \).
In a Monte Carlo sensitivity analysis, concept A wins 52 % of trials and concept B 48 %. What should the team conclude?
Show answer
The decision is not robust; gather better evidence on the key scores or consider a hybrid before committing.
Why did Team Tern choose a staged picker built on a spotter?
Show answer
The base delivers useful mapping value early with low risk, while grasping is added later; the project succeeds at several levels of completion.
Write a well-formed spike question with a time box for Tern's gripper.
Show answer
For example: can a hobby two-finger gripper lift dry crushed cans from loose sand in at least 7 of 10 tries? Time box: three hours.
What should the concept section of the SRR package contain?
Show answer
Functional decomposition, morphological chart, concepts, screening, weighted matrix with weights and evidence, sensitivity analysis and the decision rationale.
Lesson quiz · 5 questions
Score 60% or more to complete this lesson.
Create a free account to save your progress, take quizzes and earn a certificate.