
STAT-151 · Lesson 12 of 12 · 33 min
Analysis of variance and experimental design
Lesson 8 compared two groups. Experiments often compare more: four fertilizer formulations, five incubation temperatures, three diets crossed with two strains of mice. Running a t test for every pair inflates the false positive rate and ignores the structure of the design. The analysis of variance (ANOVA), developed by R. A. Fisher at the Rothamsted agricultural research station in the 1920s alongside the principles of randomization and blocking, compares several means in one analysis by partitioning the total variation in the data into parts attributable to different sources. This final lesson covers one-way ANOVA, follow-up comparisons, two-way designs with interaction, randomized blocks, the control of multiple comparisons, and an end-to-end example that draws the course together.
The idea of ANOVA
Suppose k groups are compared, with H₀: μ₁ = μ₂ = … = μ_k. If H₀ is true, the group means should differ only by about as much as random variation within groups would produce. ANOVA compares two estimates of variance. The between-group mean square measures how much the group means vary around the grand mean; the within-group mean square measures how much observations vary around their own group means. Their ratio is the F statistic.
If H₀ is true, both mean squares estimate σ² and F is near 1. If the group means really differ, the between-group mean square is inflated and F is large. Under H₀ and the usual assumptions, F follows an F distribution with k − 1 and N − k degrees of freedom, where N is the total number of observations. The total sum of squares splits exactly into between and within parts, SS_total = SS_between + SS_within, which is why the method is called the analysis of variance.
One-way ANOVA
import numpy as np
from scipy import stats
rng = np.random.default_rng(1529)

# Invented: dry biomass (g) of wheat seedlings under four nitrogen treatments, 8 pots each
groups = {"control": rng.normal(4.0, 0.8, 8), "low N": rng.normal(4.6, 0.8, 8),
          "medium N": rng.normal(5.5, 0.8, 8), "high N": rng.normal(5.7, 0.8, 8)}
data = list(groups.values())
y = np.concatenate(data); N, k = y.size, len(data)
grand = y.mean()
ss_b = sum(g.size*(g.mean() - grand)**2 for g in data)
ss_w = sum(np.sum((g - g.mean())**2) for g in data)
ms_b, ms_w = ss_b/(k - 1), ss_w/(N - k)
F = ms_b/ms_w
print(f"{'source':9s} {'df':>3s} {'SS':>8s} {'MS':>8s} {'F':>7s}")
print(f"{'between':9s} {k-1:3d} {ss_b:8.3f} {ms_b:8.3f} {F:7.2f}")
print(f"{'within':9s} {N-k:3d} {ss_w:8.3f} {ms_w:8.3f}")
print(f"{'total':9s} {N-1:3d} {ss_b + ss_w:8.3f}")
print(f"p = {stats.f.sf(F, k-1, N-k):.2g}; scipy f_oneway gives F = {stats.f_oneway(*data).statistic:.2f}")
print(f"eta squared = SS_between/SS_total = {ss_b/(ss_b + ss_w):.2f}")
for name, g in groups.items():
print(f" {name:9s} mean = {g.mean():.2f} g")source df SS MS F between 3 12.316 4.105 8.02 within 28 14.339 0.512 total 31 26.654 p = 0.00052; scipy f_oneway gives F = 8.02 eta squared = SS_between/SS_total = 0.46 control mean = 4.16 g low N mean = 4.96 g medium N mean = 5.60 g high N mean = 5.72 g
The ANOVA table summarizes the partition. η² (eta squared), the proportion of total variation explained by the treatments, is the ANOVA counterpart of R². ANOVA is in fact a special case of regression with indicator variables for the groups, so everything in lessons 10 and 11 about residuals and assumptions applies.
The assumptions are independence (from randomization and proper replication), approximately normal residuals, and similar variances across groups. One-way ANOVA is fairly robust to non-normality with moderate, equal group sizes, and to unequal variances when group sizes are equal. When variances differ and sizes are unequal, Welch’s ANOVA is the safer choice, as Welch’s t test was for two groups. The rank-based Kruskal–Wallis test (stats.kruskal) is the nonparametric alternative.
Follow-up comparisons
A significant F test says that not all means are equal but not which ones differ. Comparing every pair of k groups involves k(k − 1)/2 comparisons, six for four groups, and testing each at α = 0.05 raises the chance of at least one false positive well above 5 percent. Tukey’s honestly significant difference (HSD) procedure compares all pairs while holding the family-wise error rate, the probability of any false positive among the comparisons, at α. When a few specific comparisons were planned in advance, such as each treatment against the control, more powerful methods such as Dunnett’s test, or a small number of pre-specified contrasts, are appropriate.
import numpy as np
from scipy import stats
rng = np.random.default_rng(1529)
names = ["control", "low N", "medium N", "high N"]
data = [rng.normal(m, 0.8, 8) for m in (4.0, 4.6, 5.5, 5.7)]   # same data as above
res = stats.tukey_hsd(*data)
ci = res.confidence_interval(0.95)
for i in range(4):
    for j in range(i + 1, 4):
        print(f"{names[j]:8s} - {names[i]:8s}: diff = {data[j].mean() - data[i].mean():5.2f}, "
f"95% CI {-ci.high[i, j]:5.2f} to {-ci.low[i, j]:5.2f}, adj. p = {res.pvalue[i, j]:.3f}")low N - control : diff = 0.80, 95% CI -0.18 to 1.78, adj. p = 0.137 medium N - control : diff = 1.44, 95% CI 0.47 to 2.42, adj. p = 0.002 high N - control : diff = 1.56, 95% CI 0.58 to 2.54, adj. p = 0.001 medium N - low N : diff = 0.64, 95% CI -0.33 to 1.62, adj. p = 0.296 high N - low N : diff = 0.76, 95% CI -0.22 to 1.73, adj. p = 0.173 high N - medium N: diff = 0.11, 95% CI -0.86 to 1.09, adj. p = 0.989
Two-way ANOVA and interaction
A factorial experiment crosses two or more factors, so that every combination of levels is tested. Factorial designs are efficient, because every observation contributes information about every factor, and they are the only way to detect interactions, where the effect of one factor depends on the level of another. A two-way ANOVA partitions the variation into the main effect of factor A, the main effect of factor B, the A × B interaction, and the residual.
The invented experiment below crosses two watering regimes with three nitrogen levels, with five pots per combination. In a balanced design like this, the sums of squares can be computed directly from the cell, row and column means.
import numpy as np
from scipy import stats
rng = np.random.default_rng(1530)

# Invented 2 x 3 factorial: water (dry, wet) x nitrogen (0, 50, 100 kg/ha), 5 pots per cell
cell_means = np.array([[3.0, 3.6, 3.8],      # dry: nitrogen helps a little
                       [3.4, 5.0, 6.4]])     # wet: nitrogen helps a lot
r = 5
y = cell_means[:, :, None] + rng.normal(0, 0.6, (2, 3, r))
a, b = y.shape[0], y.shape[1]
grand = y.mean()
mA, mB, mAB = y.mean(axis=(1, 2)), y.mean(axis=(0, 2)), y.mean(axis=2)
ss_A = b*r*np.sum((mA - grand)**2)
ss_B = a*r*np.sum((mB - grand)**2)
ss_AB = r*np.sum((mAB - mA[:, None] - mB[None, :] + grand)**2)
ss_E = np.sum((y - mAB[:, :, None])**2)
df = {"water": a - 1, "nitrogen": b - 1, "water x N": (a - 1)*(b - 1), "residual": a*b*(r - 1)}
ss = {"water": ss_A, "nitrogen": ss_B, "water x N": ss_AB, "residual": ss_E}
ms_E = ss_E/df["residual"]
for src in ("water", "nitrogen", "water x N"):
    F = ss[src]/df[src]/ms_E
    print(f"{src:10s} df = {df[src]}, SS = {ss[src]:6.2f}, F = {F:6.2f}, p = {stats.f.sf(F, df[src], df['residual']):.2g}")
print(f"{'residual':10s} df = {df['residual']}, SS = {ss_E:6.2f}, MS = {ms_E:.3f}")
print("cell means (rows dry, wet; columns N 0, 50, 100):")
print(np.round(mAB, 2))water df = 1, SS = 12.39, F = 32.66, p = 6.9e-06 nitrogen df = 2, SS = 22.37, F = 29.49, p = 3.4e-07 water x N df = 2, SS = 2.75, F = 3.63, p = 0.042 residual df = 24, SS = 9.10, MS = 0.379 cell means (rows dry, wet; columns N 0, 50, 100): [[2.79 3.7 4.17] [3.4 4.87 6.24]]
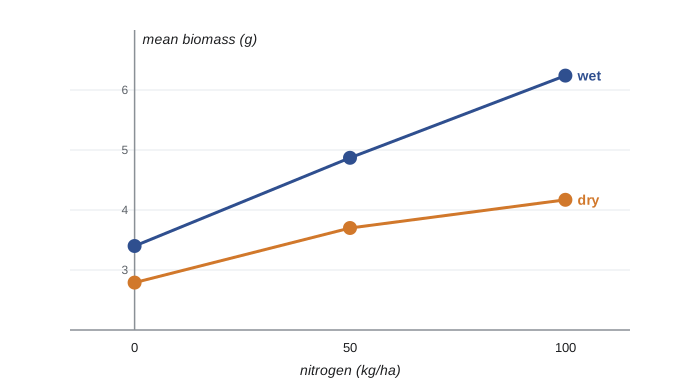
The significant interaction means that the effect of nitrogen cannot be described by a single number: it is small when water is limited and large when it is plentiful. Main effects should then be interpreted with caution, and results presented as cell means or simple effects within each level of the other factor. An interaction plot, with one line per level of one factor, makes this visible: parallel lines indicate no interaction, diverging or crossing lines indicate interaction.
Randomized block designs
Lesson 1 introduced blocking: grouping similar experimental units and randomizing treatments within each block. In agriculture, blocks are often strips of a field that differ in soil; in the laboratory, they may be days, batches of reagent or litters of animals. The analysis removes the block-to-block variation from the residual, which can greatly increase precision. A randomized complete block design with one observation per treatment per block is analyzed as a two-way ANOVA without interaction, with blocks as the second factor.
import numpy as np
from scipy import stats
rng = np.random.default_rng(1531)

# Invented: yield (t/ha) of 4 varieties in 6 field blocks with a strong fertility gradient
t, blk = 4, 6
variety = np.array([0.0, 0.3, 0.6, 0.4])
block = np.linspace(-1.5, 1.5, blk)
y = 5 + variety[:, None] + block[None, :] + rng.normal(0, 0.25, (t, blk))

grand = y.mean()
ss_T = blk*np.sum((y.mean(axis=1) - grand)**2)
ss_B = t*np.sum((y.mean(axis=0) - grand)**2)
ss_tot = np.sum((y - grand)**2)
ss_E = ss_tot - ss_T - ss_B
df_T, df_B, df_E = t - 1, blk - 1, (t - 1)*(blk - 1)
F_block = (ss_T/df_T)/(ss_E/df_E)
p_block = stats.f.sf(F_block, df_T, df_E)
F_one = stats.f_oneway(*y)                      # ignoring blocks (wrong for this design)
print(f"with blocks:    F(varieties) = {F_block:.2f} on {df_T} and {df_E} df, p = {p_block:.2g}")
print(f"ignoring blocks: F(varieties) = {F_one.statistic:.2f} on {df_T} and {t*blk - t} df, p = {F_one.pvalue:.2g}")
print(f"share of total SS due to blocks = {ss_B/ss_tot:.0%}")with blocks: F(varieties) = 5.32 on 3 and 15 df, p = 0.011 ignoring blocks: F(varieties) = 0.33 on 3 and 20 df, p = 0.8 share of total SS due to blocks = 91%
Ignoring the blocks leaves the large fertility gradient in the residual, swamping the variety differences; accounting for them reveals the differences clearly. Blocking must be planned in the design and reflected in the analysis; it cannot be added afterwards if treatments were not randomized within blocks.
Multiple comparisons beyond ANOVA
The problem of multiple testing extends far beyond pairwise comparisons. A study that measures 20 outcomes, or a genomics experiment that tests 20,000 genes, will produce false positives by chance alone. Two broad strategies exist. Controlling the family-wise error rate (FWER) limits the chance of any false positive. The Bonferroni correction tests each of m hypotheses at α/m; it is simple and always valid but conservative. The Holm procedure is uniformly more powerful: sort the p-values, compare the smallest with α/m, the next with α/(m − 1), and so on, stopping at the first that fails. Controlling the false discovery rate (FDR), the expected proportion of false positives among the rejected hypotheses, is less strict and more appropriate for large screening studies. The Benjamini–Hochberg procedure, published in 1995, is the standard method.
import numpy as np
from scipy import stats

p = np.array([0.001, 0.004, 0.012, 0.019, 0.030, 0.041, 0.090, 0.220, 0.510, 0.740])
m, alpha = p.size, 0.05
order = np.argsort(p)

bonf = p < alpha/m
holm = np.zeros(m, bool)
for rank, i in enumerate(order):
    if p[i] < alpha/(m - rank): holm[i] = True
    else: break
bh = stats.false_discovery_control(p, method="bh") < alpha

print("p-value  unadjusted  Bonferroni  Holm  BH")
for i in range(m):
    print(f"{p[i]:7.3f}  {str(p[i] < alpha):>10s}  {str(bonf[i]):>10s}  {str(holm[i]):>4s}  {str(bh[i]):>4s}")
print(f"rejections: unadjusted {np.sum(p < alpha)}, Bonferroni {bonf.sum()}, Holm {holm.sum()}, BH {bh.sum()}")p-value unadjusted Bonferroni Holm BH 0.001 True True True True 0.004 True True True True 0.012 True False False True 0.019 True False False True 0.030 True False False False 0.041 True False False False 0.090 False False False False 0.220 False False False False 0.510 False False False False 0.740 False False False False rejections: unadjusted 6, Bonferroni 2, Holm 2, BH 4
Which strategy is right depends on the consequences of a false positive. For a few confirmatory comparisons that will each be acted upon, FWER control is appropriate. For screening thousands of candidates that will be followed up in further experiments, FDR control is more sensible. The worst practice is to test many hypotheses, report only the significant ones, and make no adjustment, sometimes called p-hacking or the garden of forking paths.
Putting it all together: an end-to-end study
The final example follows one invented study from question to report, drawing on every lesson. A research group wants to know whether a commercial biochar soil amendment increases the growth of canola seedlings, and whether any effect depends on the soil type.
Worked problem
Biochar and canola growth (invented)
Plan, analyze and report a greenhouse experiment testing three biochar rates (0, 2 and 5 percent by mass) in two soil types (sandy and clay loam).
Show solution
- Question and design (lesson 1): a 3 × 2 factorial in randomized complete blocks, with greenhouse benches as blocks to absorb light and temperature gradients. The pot is the experimental unit; seedlings within a pot are subsamples and are averaged.
- Sample size (lessons 6 and 7): a pilot study suggested a residual SD of about 0.3 g once bench effects are removed; a two-sample power calculation shows that six pots per combination give about 88 percent power to detect a 0.6 g difference at α = 0.05, so the group plans six benches and 36 pots in all.
- Pre-registration: the primary outcome (dry shoot biomass at 28 days), the model (two-way ANOVA with blocks), and the planned comparisons (each biochar rate against no biochar, within each soil) are written down before planting.
- Description (lesson 2): plot the data by treatment and soil; report means, SDs and any lost pots.
- Analysis (lessons 8, 11 and 12): fit the blocked two-way ANOVA, check residuals, and estimate the planned contrasts with intervals adjusted by the Holm method.
- Reporting: give effect sizes in grams with confidence intervals, exact p-values, the interaction plot, and all outcomes measured, not only the significant ones; share the data and code.
Answer: A design that is randomized, blocked, adequately replicated and pre-registered, analyzed with a model that matches it and reported with effect sizes and intervals, gives conclusions that others can trust and reproduce.
import numpy as np
from scipy import stats
rng = np.random.default_rng(1532)

# Invented data: 3 biochar rates x 2 soils x 6 benches (blocks), one pot per combination per bench
rates, soils, benches = [0, 2, 5], ["sandy", "clay loam"], 6
true = np.array([[2.0, 2.5, 2.9],      # sandy: biochar helps
                 [2.6, 2.7, 2.6]])     # clay loam: little effect
bench = rng.normal(0, 0.3, benches)
y = true[:, :, None] + bench[None, None, :] + rng.normal(0, 0.45, (2, 3, benches))

a, b, r = y.shape
grand = y.mean()
mS, mR, mSR, mK = y.mean(axis=(1, 2)), y.mean(axis=(0, 2)), y.mean(axis=2), y.mean(axis=(0, 1))
ss = {"soil": b*r*np.sum((mS - grand)**2), "biochar": a*r*np.sum((mR - grand)**2),
      "soil x biochar": r*np.sum((mSR - mS[:, None] - mR[None, :] + grand)**2),
      "bench (block)": a*b*np.sum((mK - grand)**2)}
ss_E = np.sum((y - grand)**2) - sum(ss.values())
df = {"soil": a - 1, "biochar": b - 1, "soil x biochar": (a - 1)*(b - 1), "bench (block)": r - 1}
df_E = a*b*r - 1 - sum(df.values())
ms_E = ss_E/df_E
for src in ss:
    F = ss[src]/df[src]/ms_E
    print(f"{src:15s} df = {df[src]}, F = {F:6.2f}, p = {stats.f.sf(F, df[src], df_E):.2g}")
print(f"residual        df = {df_E}, MS = {ms_E:.3f}")

# Planned contrasts: each biochar rate vs none, within each soil (4 contrasts), Holm-adjusted
se = np.sqrt(2*ms_E/r)
tcrit_df = df_E
pvals, rows = [], []
for i, soil in enumerate(soils):
    for j in (1, 2):
        d = mSR[i, j] - mSR[i, 0]
        t = d/se
        pvals.append(2*stats.t.sf(abs(t), tcrit_df)); rows.append((soil, rates[j], d))
pvals = np.array(pvals)
order = np.argsort(pvals); m = len(pvals); adj = np.empty(m); running = 0.0
for rank, k in enumerate(order):
    running = max(running, min(1.0, (m - rank)*pvals[k])); adj[k] = running
tq = stats.t.ppf(1 - 0.05/(2*m), tcrit_df)       # Bonferroni-width intervals (conservative)
for (soil, rate, d), pa in zip(rows, adj):
print(f"{soil:9s} {rate}% vs 0%: diff = {d:5.2f} g, simultaneous 95% CI {d - tq*se:5.2f} to {d + tq*se:5.2f}, Holm p = {pa:.3f}")soil df = 1, F = 0.11, p = 0.75 biochar df = 2, F = 5.88, p = 0.0081 soil x biochar df = 2, F = 4.52, p = 0.021 bench (block) df = 5, F = 5.18, p = 0.0021 residual df = 25, MS = 0.162 sandy 2% vs 0%: diff = 0.36 g, simultaneous 95% CI -0.27 to 0.98, Holm p = 0.413 sandy 5% vs 0%: diff = 1.04 g, simultaneous 95% CI 0.41 to 1.66, Holm p = 0.001 clay loam 2% vs 0%: diff = 0.07 g, simultaneous 95% CI -0.56 to 0.69, Holm p = 1.000 clay loam 5% vs 0%: diff = 0.08 g, simultaneous 95% CI -0.55 to 0.70, Holm p = 1.000
The analysis tells a clear story. In sandy soil, the 5 percent rate increases seedling biomass by about 1 g, an effect whose simultaneous interval excludes zero; the 2 percent rate gives a smaller gain that the experiment cannot distinguish from zero. In clay loam, which already holds water well, biochar has little effect at either rate. This difference between soils is the soil × biochar interaction. The bench blocks absorb a substantial part of the variation, sharpening the comparisons. The residual SD in the experiment (√0.162 ≈ 0.40 g) turned out larger than the 0.3 g assumed in planning, so the realized power was lower than intended, one reason the 2 percent effect remains uncertain. Honest reporting says so, and a follow-up study could use more benches. A report would present the interaction plot and the four contrasts with their simultaneous intervals, and discuss the practical meaning of the gain in sandy soil.
Reproducibility and research integrity
Statistics serves science only when the work can be checked. Reproducible analysis means that another researcher, given the data and code, obtains the same numbers. That requires scripts rather than manual spreadsheet steps, recorded random seeds (as in every simulation in this course), documented software versions, and data that are archived with clear metadata. Pre-registration of hypotheses, outcomes and analyses, already standard for clinical trials, separates confirmatory tests from exploratory findings and protects against the forking paths described above. Replication by independent groups remains the ultimate test of any result.
Research involving human participants in the United States must also follow the Federal Policy for the Protection of Human Subjects (the Common Rule), which requires review by an institutional review board, informed consent and protection of privacy. Animal research is overseen by institutional animal care and use committees under the Animal Welfare Act and Public Health Service policy. Statistical design is part of ethics: an underpowered study exposes participants or animals to risk without a realistic chance of answering its question, and an oversized one uses more than necessary.
Where next? STAT-251 develops probability theory in more depth, and STAT-252 provides the mathematical foundations of estimation and testing that underlie the methods in this course. Courses in specific fields extend them: generalized linear models for counts and binary outcomes, mixed models for repeated and clustered measurements, survival analysis, time series, and Bayesian methods, which make the reasoning of lesson 3 the basis for all inference.
Common mistakes
MistakeCompare four groups with six separate t tests at α = 0.05.
InsteadUse ANOVA followed by Tukey’s HSD or pre-planned contrasts to control the family-wise error rate.
MistakeA significant F test shows that all the means differ.
InsteadIt shows only that at least one mean differs; follow-up comparisons identify which.
MistakeInterpret main effects as usual when the interaction is significant.
InsteadDescribe the effect of each factor within levels of the other, using cell means and an interaction plot.
MistakeAnalyze a randomized block experiment with one-way ANOVA.
InsteadInclude blocks in the model; otherwise block variation inflates the residual and hides treatment effects.
MistakeUse Bonferroni for 20,000 gene tests.
InsteadFor large screening studies, control the false discovery rate with Benjamini–Hochberg.
MistakeDecide which outcomes and analyses to report after seeing the results.
InsteadPre-register the primary outcomes and analyses and report all outcomes measured.
Summary and key terms
- ANOVA compares several means by partitioning variation into between-group and within-group parts; F is their ratio.
- A significant F test is followed by Tukey’s HSD for all pairs or by planned contrasts such as Dunnett’s test.
- Factorial designs estimate several factors efficiently and reveal interactions, shown by non-parallel lines in an interaction plot.
- Randomized block designs remove known sources of variation and must be analyzed with blocks in the model.
- Multiple testing inflates false positives; Bonferroni and Holm control the family-wise error rate, and Benjamini–Hochberg controls the false discovery rate.
- A sound study combines randomization, replication, blocking, adequate power and pre-registration, and reports effect sizes with intervals.
- Reproducible code, archived data, ethical review and independent replication make statistical conclusions trustworthy.
- analysis of variance
- A method that compares several means by partitioning total variation into components.
- F statistic
- The ratio of the between-group mean square to the within-group mean square.
- mean square
- A sum of squares divided by its degrees of freedom.
- eta squared
- The proportion of total variation explained by a factor.
- Tukey’s HSD
- A procedure for comparing all pairs of means while controlling the family-wise error rate.
- factorial design
- An experiment in which every combination of the levels of two or more factors is tested.
- randomized block design
- A design in which treatments are randomized within groups of similar units.
- family-wise error rate
- The probability of at least one false positive among a set of tests.
- false discovery rate
- The expected proportion of false positives among rejected hypotheses.
- pre-registration
- Recording hypotheses, outcomes and analysis plans before data are collected.
Practice problems
Work each problem on paper first, then reveal the answer to check.
An ANOVA compares 5 groups of 6. What are the degrees of freedom for F?
Show answer
Between: 4; within: 25.
SS_between = 24 and SS_within = 60 with the df above. Compute F.
Show answer
MS_between = 6, MS_within = 2.4, F = 2.5.
For the same data, find η².
Show answer
24/84 ≈ 0.29.
How many pairwise comparisons are there among 6 groups?
Show answer
6 × 5/2 = 15.
Why not test all pairs with t tests at α = 0.05?
Show answer
The chance of at least one false positive rises far above 0.05.
In an interaction plot, the lines cross. What does this mean?
Show answer
There is an interaction: the effect of one factor reverses depending on the other.
Why does blocking increase power?
Show answer
It removes variation between blocks from the residual, making treatment differences easier to detect.
Ten tests are performed. What is the Bonferroni threshold at α = 0.05?
Show answer
0.005.
When is FDR control preferable to FWER control?
Show answer
In large screening studies where some false positives are acceptable because findings will be followed up.
List three practices that make an analysis reproducible.
Show answer
Scripted analysis, recorded random seeds and software versions, and archived data with metadata.
Lesson quiz · 5 questions
Score 60% or more to complete this lesson.
Create a free account to save your progress, take quizzes and earn a certificate.