
BUS-220 · Lesson 2 of 12 · 31 min
The marketing environment and strategy
No marketing decision is made in a vacuum. Customers' tastes shift, competitors launch new products, laws change, the economy expands and contracts, and new technologies open and close opportunities. A firm that watches these forces can adapt early; one that ignores them can be overtaken quickly. This lesson first maps the forces that make up the marketing environment, then shows how organizations turn their reading of the environment into strategy: a mission, an analysis of strengths and weaknesses, choices about growth and, finally, a written marketing plan. Corporate strategy in full is the subject of BUS-450 Strategic Management; here the focus is on the part marketing plays.
The microenvironment
The microenvironment consists of the actors close to the company that affect its ability to serve its customers. The first is the company itself. Marketing decisions depend on finance for budgets, on operations for capacity and quality, on research and development for new products and on human resources for the people who serve customers. A promise in an advertisement that operations cannot keep damages trust, which is why the marketing concept asks every department to think about the customer.
Suppliers provide the inputs the company needs. Supply shortages, price increases and quality problems can hurt sales and margins, as many firms learned during the pandemic-era disruptions of 2020 to 2022 and again with tariff changes in 2025. Smart marketers treat key suppliers as partners and build some resilience into their plans, for example by qualifying more than one source for critical components.
Marketing intermediaries help the company promote, sell and distribute its products to final buyers. They include resellers such as wholesalers and retailers, physical distribution firms such as warehouses and carriers, marketing service agencies such as research firms and advertising agencies, and financial intermediaries such as banks, payment processors and insurers. Large retailers and online marketplaces can hold great power over the brands they carry, a theme taken up in lesson 10.
Competitors are the other firms trying to win the same customers. A business must provide greater value than competitors, or at least different value that some customers prefer, to succeed. Competition operates at several levels: direct competitors offering the same kind of product, substitute products that do the same job differently, and the broader competition for the customer's limited budget. A streaming service competes with other streaming services, with video games and social media for leisure time, and with everything else a household might spend money on.
Publics are groups that have an actual or potential interest in, or impact on, the organization's ability to achieve its goals. They include financial publics such as investors and lenders, media publics, government publics, citizen-action groups, local community members, the general public and internal publics such as employees. Public relations, discussed in lesson 11, is largely about managing relationships with these groups.
Finally, customers are the most important actors. Markets can be consumer markets of individuals and households, business markets of firms that buy goods and services for further processing or for use in their operations, reseller markets, government markets and international markets. Each has distinct characteristics, and lessons 4 and 5 examine consumer and business buyers in turn.
The macroenvironment: PESTEL
The macroenvironment consists of larger societal forces that affect the whole microenvironment. A common checklist is PESTEL: political, economic, social, technological, environmental and legal forces. The categories overlap, and the point of the checklist is not to put every trend in exactly the right box but to make sure nothing important is missed.
Political and legal forces
Political forces include government policy, trade relations and political stability. Canadian marketers have had to plan around changes in trade with the United States, Canada's largest trading partner, including the tariffs and counter-tariffs introduced from 2025 and the review of the Canada–United States–Mexico Agreement scheduled for 2026. Many Canadian consumers responded to the 2025 trade dispute by deliberately seeking out Canadian-made products, and retailers added 'Product of Canada' and 'Made in Canada' signs to shelves, a reminder that political events can change buying behaviour quickly.
Legal forces are the laws and regulations that govern marketing. In Canada they include the Competition Act, which prohibits false or misleading representations and drip pricing; provincial consumer protection acts; the Consumer Packaging and Labelling Act and the Food and Drugs Act; the Personal Information Protection and Electronic Documents Act (PIPEDA) and Canada's Anti-Spam Legislation (CASL); and, in Quebec, the Charter of the French Language, whose rules on French in commercial signage and on products were tightened from June 2025. BUS-210 lesson 11 explains these laws; this course shows how they shape everyday marketing decisions.
Economic forces
Economic forces affect purchasing power and spending patterns. Marketers watch income levels and their distribution, inflation, interest rates, unemployment, exchange rates and consumer confidence. When inflation rose sharply in 2022 and 2023, many households traded down to private-label grocery products and discount retailers, and firms faced difficult choices about passing on cost increases. Shrinkflation, reducing package size while holding the price, became a common and controversial response.
Income distribution matters as much as the average. In both Canada and the United States, spending by high-income households has held up better than spending by lower-income households in recent years, which has helped luxury and premium brands at the top and discount retailers at the bottom while squeezing brands in the middle. Marketers who understand where their customers sit can adjust their product lines and pricing accordingly.
Social and demographic forces
Demography is the study of human populations in terms of size, density, location, age, gender, ethnicity and other statistics. Statistics Canada estimated the population at about 41.4 million on April 1, 2026, having fallen slightly in the first quarter of the year as immigration targets were reduced and the number of temporary residents declined. Canada's population is ageing, with a growing share over 65, and it is highly diverse: in the 2021 census about one in four people were immigrants, the highest share among G7 countries. Most Canadians live in a band near the US border, concentrated in the Toronto, Montreal and Vancouver regions, with fast growth in Alberta.
Generational groups are a popular, if rough, way to describe changing values. Baby boomers (born roughly 1946 to 1964) hold a large share of wealth. Generation X (about 1965 to 1980) is in its peak earning years. Millennials (about 1981 to 1996) are now the largest group of parents. Generation Z (about 1997 to 2012) grew up with smartphones and social media and is entering the workforce. Generation Alpha is the children of millennials. Generational labels can be useful shorthand, but people within a generation differ widely, and life stage, income and culture often explain behaviour better than birth year.
Cultural values and lifestyle trends also matter. Interest in health and wellness, convenience, authenticity, local products, remote and hybrid work, and value-consciousness have all reshaped categories from food to fashion to housing. Marketers track these trends through research and social listening, and they distinguish lasting shifts from short-lived fads.
Technological forces
Technology creates new products and markets and destroys old ones. Smartphones replaced standalone cameras, music players and maps. Streaming displaced cable television and video rental. Generative AI, which became widely available in 2023, is now changing how people search for information, how marketers create content and how customers interact with service chatbots. Each technological shift creates opportunities for firms that move early and threats for firms tied to the old way of doing things. Lesson 11 returns to AI in marketing communications.
Environmental forces
The natural environment covers the physical resources that firms use and the effects of their activities on ecosystems and the climate. Marketers face increasing pressure from customers, investors and regulators to reduce waste, packaging and emissions. Extended producer responsibility programs, which make producers responsible for the packaging they put on the market, are expanding across Canadian provinces and several US states. Environmental claims are also a growing legal risk, as lesson 12 explains.
| PESTEL force | Example trend | Possible marketing response |
|---|---|---|
| Political | Trade disputes and tariffs | Source locally; highlight domestic origin; review prices |
| Economic | Price-sensitive households trading down | Introduce a value line; offer smaller pack sizes |
| Social | Ageing population | Design easier-to-open packaging and larger text; target retirees |
| Technological | AI-powered search and shopping assistants | Publish clear, structured product information; monitor how AI tools describe the brand |
| Environmental | Producer responsibility for packaging | Reduce and simplify packaging; use recyclable materials |
| Legal | Stricter rules on hidden fees and green claims | Show all-in prices; substantiate environmental claims before using them |
From analysis to strategy: mission and objectives
Strategic planning is the process of developing and maintaining a fit between the organization's goals and capabilities and its changing opportunities. At the corporate level, it starts with a mission statement, a statement of the organization's purpose, of what it wants to accomplish in the larger environment. A good mission is market-oriented, defining the business in terms of satisfying basic customer needs rather than in terms of products. 'We make mattresses' is product-oriented; 'We help people sleep better' is market-oriented and opens the door to pillows, sleep tracking and bedroom design.
The mission then guides specific, measurable objectives. Marketing objectives should be SMART: specific, measurable, achievable, relevant and time-bound. 'Increase awareness' is vague. 'Raise unaided brand awareness among women aged 25 to 44 in Ontario from 12 % to 20 % by December 2027' is a SMART objective that can guide spending and be checked against results.
SWOT analysis
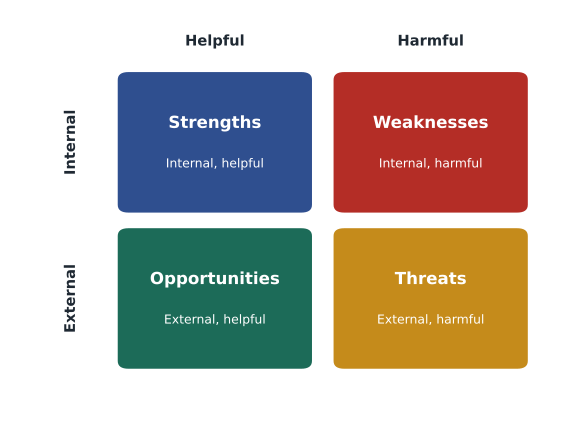
A SWOT analysis summarizes the company's internal strengths and weaknesses and its external opportunities and threats. Strengths and weaknesses are things the company controls, such as its brand, skills, costs and distribution. Opportunities and threats come from the environment and from competitors. The value of a SWOT lies not in the list itself but in the strategic questions it raises: how can we use our strengths to seize opportunities, and how can we shore up weaknesses that leave us exposed to threats?
Worked problem
A SWOT for a craft brewery
A small craft brewery in a mid-sized city has a loyal local following, an award-winning lager and a taproom that is busy at weekends. It has limited cash, no presence in grocery stores and one brewer who knows all the recipes. Interest in low- and no-alcohol beer is rising, a new provincial or state rule makes it easier to sell through grocery stores, and two large brewers have launched their own craft-style brands. Build a SWOT and suggest two strategic moves.
Show solution
- Strengths: loyal local following; award-winning lager; busy taproom.
- Weaknesses: limited cash; no grocery distribution; dependence on one brewer.
- Opportunities: growing demand for low- and no-alcohol beer; easier grocery sales.
- Threats: craft-style brands from large brewers with big marketing budgets.
- Strength-opportunity move: use the award and local loyalty to win a few grocery listings, starting with independent stores near the taproom.
- Weakness-threat move: document recipes and train a second brewer, and develop a low-alcohol beer that the large brewers' craft-style brands do not yet offer.
Answer: The SWOT points to grocery distribution built on local reputation, a new low-alcohol product and reducing the key-person risk.
Growth strategies: the Ansoff matrix
Igor Ansoff's product–market expansion grid identifies four ways to grow. Market penetration means selling more of current products to current markets, for example through price promotions, loyalty programs or wider distribution. Market development means taking current products to new markets, such as new regions, countries or customer segments. Product development means offering new products to current markets, such as a coffee chain adding breakfast sandwiches. Diversification means new products for new markets, the riskiest option because the firm has experience with neither.
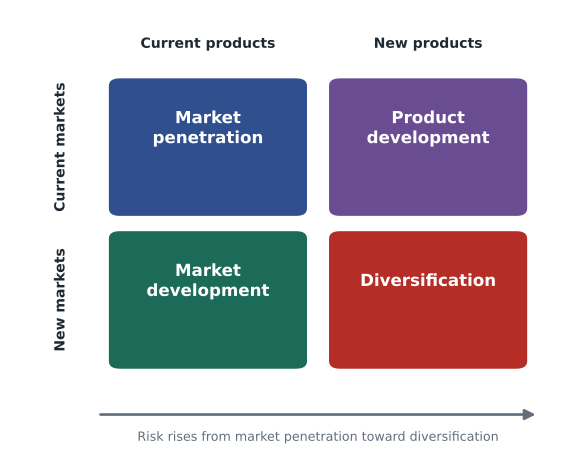
Risk rises as a firm moves away from what it knows. One rough rule of thumb from strategy practice is that the chance of success is highest for penetration, lower for market or product development and lowest for diversification, although actual odds depend heavily on the firm's capabilities and the specific opportunity. Firms often pursue several cells at once, with most investment in penetration and smaller bets on the others.
Portfolio analysis
Companies with several products or business units must decide how to allocate resources among them. The Boston Consulting Group's growth–share matrix classifies units by market growth rate and relative market share. Stars have high share in high-growth markets and need investment to keep growing. Cash cows have high share in low-growth markets and generate cash. Question marks have low share in high-growth markets and need a decision: invest heavily or withdraw. Dogs have low share in low-growth markets and may be harvested or divested. Relative market share is the unit's share divided by that of its largest competitor.
Worked problem
Placing products on the growth–share matrix
A snack company has three lines. Line A has 30 % of a market growing at 2 % a year, and its largest competitor has 15 %. Line B has 8 % of a market growing at 14 %, and its largest competitor has 24 %. Line C has 20 % of a market growing at 12 %, and its largest competitor has 10 %. Using a growth cut-off of 10 % and a relative share cut-off of 1.0, classify each line.
Show solution
- Line A: relative share = 30 ÷ 15 = 2.0 (high); growth 2 % (low). Cash cow.
- Line B: relative share = 8 ÷ 24 ≈ 0.33 (low); growth 14 % (high). Question mark.
- Line C: relative share = 20 ÷ 10 = 2.0 (high); growth 12 % (high). Star.
- Implication: use cash from A to fund C's growth, and decide whether B can realistically gain share or should be dropped.
Answer: A is a cash cow, B a question mark and C a star; the matrix suggests channelling A's cash into C and making a clear decision on B.
The matrix is simple and memorable, but it has limits. Market share is not the only source of profitability, defining the market is often arguable, and the labels can become self-fulfilling if managers starve a so-called dog that could be revived. Most firms now use portfolio tools as a starting point for discussion rather than a mechanical rule.
The marketing plan
A marketing plan turns strategy into action for a product, brand or market over a defined period, usually a year. Plans vary, but most contain the same core sections. Lesson 12 asks you to write one, so it is worth knowing the structure now.
| Section | Purpose |
|---|---|
| Executive summary | A brief overview of goals and recommendations for busy readers |
| Situation analysis | The market, customers, competitors, environment and a SWOT |
| Objectives | SMART marketing and financial goals |
| Target market and positioning | Chosen segments and the value proposition (lesson 6) |
| Marketing mix | Product, price, place and promotion decisions (lessons 7 to 11) |
| Budget and forecast | Spending by activity and expected sales and profit |
| Implementation | Who does what, by when |
| Controls and metrics | How progress will be measured and when plans will be adjusted |
Plans should be living documents. Marketing control means measuring results, comparing them with objectives, diagnosing gaps and taking corrective action. A good plan names its key metrics in advance, such as awareness, trial, conversion rates, market share, customer acquisition cost and retention, so that the team knows early whether the strategy is working.
Common mistakes
MistakeTreating PESTEL as a box-filling exercise.
InsteadUse it to identify the few trends that matter most and decide how to respond.
MistakeWriting vague objectives such as "grow the brand".
InsteadSet SMART objectives with a measure, target and deadline.
MistakeListing SWOT items without drawing conclusions.
InsteadMatch strengths to opportunities and address weaknesses exposed to threats.
MistakeAssuming diversification is the fastest route to growth.
InsteadRecognize that risk rises as products and markets become less familiar; penetration is usually safest.
MistakeWriting a marketing plan and filing it away.
InsteadTrack named metrics and adjust the plan when results diverge from objectives.
Summary and key terms
- The microenvironment includes the company, suppliers, intermediaries, competitors, publics and customers.
- The macroenvironment can be scanned with PESTEL: political, economic, social, technological, environmental and legal forces.
- Demographic, economic and political shifts can change buying behaviour quickly.
- A market-oriented mission defines the business by the needs it serves; objectives should be SMART.
- SWOT analysis is valuable for the strategic conclusions it prompts.
- The Ansoff grid offers penetration, market development, product development and diversification, in rising order of risk.
- The growth–share matrix classifies units as stars, cash cows, question marks and dogs using growth and relative share.
- A marketing plan moves from situation analysis to objectives, targeting, the mix, budget, implementation and controls.
- Microenvironment
- Actors close to the company that affect its ability to serve customers.
- Macroenvironment
- Larger societal forces that affect the whole microenvironment.
- PESTEL
- A checklist of political, economic, social, technological, environmental and legal forces.
- Demography
- The study of human populations in terms of size, location, age and other statistics.
- Mission statement
- A statement of the organization's purpose.
- SMART objective
- An objective that is specific, measurable, achievable, relevant and time-bound.
- SWOT analysis
- An assessment of internal strengths and weaknesses and external opportunities and threats.
- Market penetration
- Growing by selling more current products to current markets.
- Diversification
- Growing by offering new products in new markets.
- Relative market share
- A unit's market share divided by that of its largest competitor.
Practice problems
Work each problem on paper first, then reveal the answer to check.
Name the six actors of the microenvironment.
Show answer
The company, suppliers, intermediaries, competitors, publics and customers.
Classify a rise in interest rates within PESTEL.
Show answer
Economic.
Rewrite "improve customer satisfaction" as a SMART objective.
Show answer
For example: raise average satisfaction from 7.8 to 8.5 out of 10 among repeat customers by June 30 next year.
Is "a new competitor entering the market" a weakness or a threat?
Show answer
A threat; it is external.
A coffee chain opens cafés in a new country. Which Ansoff strategy is this?
Show answer
Market development.
A unit has 12 % share; the largest competitor has 30 %. What is its relative share?
Show answer
0.4.
A unit with high relative share in a slow-growing market is called what?
Show answer
A cash cow.
Give two limitations of the growth–share matrix.
Show answer
Market definition is arguable; share is not the only route to profit; labels can become self-fulfilling.
List the main sections of a marketing plan.
Show answer
Executive summary, situation analysis, objectives, targeting and positioning, mix, budget, implementation, controls.
Portfolio task: run a quick PESTEL scan for an industry you know and pick the two most important trends.
Show answer
Answers vary; a good answer explains why those two trends matter most.
Lesson quiz · 5 questions
Score 60% or more to complete this lesson.
Create a free account to save your progress, take quizzes and earn a certificate.