
BUS-220 · Lesson 6 of 12 · 33 min
Segmentation, targeting and positioning
No company can serve every customer in a broad market equally well. Customers are too numerous, too widely spread and too varied in their needs and buying habits. Instead of trying to please everyone, successful firms divide the market into meaningful groups, choose the groups they can serve best and then design an offer that stands out in those customers' minds. These three steps, segmentation, targeting and positioning (STP), are the heart of customer-driven marketing strategy. BUS-101 introduced STP briefly; this lesson works through each step with practical tools, including segment scoring, perceptual maps, positioning statements and a more careful calculation of customer lifetime value.
Segmenting consumer markets
Market segmentation is dividing a market into distinct groups of buyers who have different needs, characteristics or behaviours and who might require separate products or marketing programs. There is no single way to segment a market. Marketers try different variables, alone and in combination, to find the best view of the market's structure. The main bases for segmenting consumer markets are geographic, demographic, psychographic and behavioural.
Geographic segmentation divides the market into nations, regions, provinces or states, cities, neighbourhoods or climate zones. A clothing retailer stocks heavier coats in Winnipeg than in Victoria; a restaurant chain adapts menus to regional tastes. Geodemographic systems, such as Environics Analytics' PRIZM in Canada and Claritas PRIZM in the United States, combine location with demographic and lifestyle data to classify neighbourhoods into segments with memorable names.
Demographic segmentation divides the market by variables such as age, life-cycle stage, gender, income, occupation, education, ethnicity and generation. Demographic factors are the most popular bases because needs often vary with them and because they are easy to measure. Income segmentation is common for cars, clothing, travel and financial services. Marketers must be careful, though, not to rely on stereotypes: not all retirees are frail or technophobic, and many high earners shop at discount stores.
Psychographic segmentation divides buyers by lifestyle, personality and values. People in the same demographic group can have very different psychographic profiles. Two 35-year-old accountants with similar incomes might be, respectively, an outdoor adventurer and a home-focused gourmet cook, with quite different spending patterns.
Behavioural segmentation divides buyers by their knowledge, attitudes, uses or responses to a product. Many marketers believe behavioural variables are the best starting point. Occasion segmentation groups buyers by when they get the idea to buy or use the product, such as breakfast, holidays or Valentine's Day. Benefit segmentation groups buyers by the benefits they seek; in toothpaste, some want whitening, some decay prevention, some sensitivity relief and some the lowest price. Markets can also be segmented by user status (non-users, ex-users, first-time users, regular users), usage rate (light, medium and heavy users) and loyalty status.
| Basis | Example variables | Example |
|---|---|---|
| Geographic | Region, city size, climate, urban or rural | Snow tires marketed in colder regions |
| Demographic | Age, life stage, income, gender, ethnicity | Banking packages for students |
| Psychographic | Lifestyle, values, personality | Outdoor gear for adventure-seekers |
| Behavioural | Occasions, benefits sought, usage rate, loyalty | Toothpaste for sensitive teeth |
Firms with good customer databases can segment their own customers on behaviour. A widely used method is RFM analysis, which scores customers on recency (how recently they bought), frequency (how often) and monetary value (how much they spend). Customers who bought recently, often and a lot are typically the most valuable and the most likely to respond to offers. The code below scores a small simulated customer file.
import random

random.seed(2207)
customers = []
for cid in range(1, 13):
    days_since = random.randint(3, 360)
    orders = random.randint(1, 15)
    spend = round(orders * random.uniform(25, 90), 2)
    customers.append((cid, days_since, orders, spend))

def score(value, cuts, reverse=False):
    s = 1 + sum(value > c for c in cuts)       # 1..4
    return 5 - s if reverse else s

print(" ID  days  orders   spend   R F M  RFM")
for cid, d, f, m in sorted(customers, key=lambda c: -c[3]):
    r = score(d, [30, 90, 180], reverse=True)   # recent = high score
    fs = score(f, [2, 5, 9])
    ms = score(m, [150, 300, 600])
print(f"{cid:3d} {d:5d} {f:7d} {m:8.2f} {r} {fs} {ms} {r}{fs}{ms}")ID days orders spend R F M RFM 8 360 15 1325.90 1 4 4 144 1 143 15 705.35 2 4 4 244 10 258 11 583.49 1 4 3 143 9 148 15 479.84 2 4 3 243 2 121 9 455.03 2 3 3 233 11 301 13 376.85 1 4 3 143 12 244 7 369.80 1 3 3 133 4 44 5 264.60 3 2 2 322 7 282 3 189.83 1 2 2 122 6 112 2 105.58 2 1 1 211 3 36 1 61.45 3 1 1 311 5 28 2 60.77 4 1 1 411
In the output, a customer scored 444 is a recent, frequent, high-spending champion who deserves recognition and early access to new products. A customer scored 144 has spent heavily and often but not recently, a valuable customer at risk of lapsing who might receive a win-back offer. A 411 is a new or occasional customer who could be nurtured.
Segmenting business and international markets
Business marketers use many of the same variables, plus others such as industry, company size, location, operating characteristics (technology used, user status), purchasing approaches (centralized or decentralized buying, purchasing criteria), situational factors (urgency, order size) and personal characteristics of buyers (loyalty, attitude toward risk). Many firms segment business customers by size and potential, serving large accounts with dedicated account teams and smaller ones through inside sales and online channels. International markets can be segmented by geography, economic development, political and legal factors and culture, and also through intermarket segmentation, which groups consumers with similar needs across countries, such as affluent young professionals in many large cities.
Requirements for effective segmentation
Not all ways of dividing a market are useful. Dividing salt buyers into left-handed and right-handed customers is easy but pointless, because both want the same thing. To be useful, segments should be measurable (size, purchasing power and profiles can be estimated), accessible (they can be reached and served), substantial (large or profitable enough to serve), differentiable (they respond differently to different marketing mixes) and actionable (the firm can design effective programs for them).
Targeting: evaluating and selecting segments
Once segments are identified, the firm evaluates them on three broad factors: segment size and growth, segment structural attractiveness and the company's objectives and resources. A large, growing segment is not automatically attractive if it has many strong competitors, powerful buyers, easy substitutes or powerful suppliers. And even an attractive segment should be rejected if it does not fit the firm's long-run objectives or if the firm lacks the skills and resources to win there. Many firms use a weighted scoring model to compare segments.
Worked problem
Scoring segments for an e-bike maker
A maker of electric bicycles is considering three segments: urban commuters, older recreational riders and parents needing cargo bikes. It weights segment size and growth at 0.35, competitive intensity (higher score means less competition) at 0.25, fit with company strengths at 0.25 and profitability at 0.15. On a 1–10 scale, commuters score 8, 4, 7, 6; recreational riders score 6, 6, 5, 7; cargo-bike parents score 5, 8, 8, 8. Which segment should it target first?
Show solution
- Commuters = 0.35×8 + 0.25×4 + 0.25×7 + 0.15×6 = 2.80 + 1.00 + 1.75 + 0.90 = 6.45.
- Recreational = 0.35×6 + 0.25×6 + 0.25×5 + 0.15×7 = 2.10 + 1.50 + 1.25 + 1.05 = 5.90.
- Cargo parents = 0.35×5 + 0.25×8 + 0.25×8 + 0.15×8 = 1.75 + 2.00 + 2.00 + 1.20 = 6.95.
- The cargo-bike segment wins: smaller, but less contested, a strong fit and more profitable.
- Sensitivity check: if size were weighted 0.50 and fit 0.10, commuters would edge ahead, so the decision depends on how much the firm values scale versus fit.
Answer: Cargo-bike parents score highest (6.95). The analysis also shows that the choice is sensitive to weights, which should be agreed before scoring.
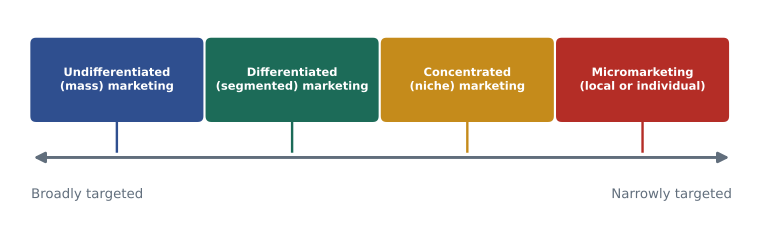
Having evaluated segments, the company decides on a targeting strategy. Targeting can be carried out at several levels, from very broad to very narrow.
Undifferentiated, or mass, marketing ignores segment differences and goes after the whole market with one offer, focusing on what is common in the needs of consumers. It is rare today, because few products satisfy everyone, and it is hard to compete against firms that serve particular segments better.
Differentiated, or segmented, marketing targets several segments and designs separate offers for each. A hotel group may run luxury, business, family and budget brands. Differentiated marketing typically creates more total sales than undifferentiated marketing, but it also increases the costs of product development, production, inventory and promotion, so the firm must weigh higher sales against higher costs.
Concentrated, or niche, marketing goes after a large share of one or a few smaller segments. Small firms often use it to compete against larger rivals by serving needs the giants overlook. Niching offers lower costs and deep customer knowledge but carries higher risk if the segment shrinks or a larger competitor moves in. Online channels have made niche strategies more practical, because small firms can now reach scattered customers cheaply.
Micromarketing tailors products and programs to the tastes of specific individuals and local customer groups. Local marketing adapts to cities, neighbourhoods and even specific stores. Individual marketing, also called one-to-one or mass customization, tailors offers to individual customers, as when online retailers personalize recommendations or a shoe brand lets buyers design their own sneakers.
Targeting raises ethical questions. Marketing to children, to people in financial difficulty or to people vulnerable to addiction can cause harm even when it is legal. Advertising of unhealthy food to children is restricted in Quebec and by industry codes elsewhere, and lenders face scrutiny when high-cost loans are aimed at low-income neighbourhoods. The issue is not who is targeted but whether the offer serves the target customers' interests. Lesson 12 returns to this.
Differentiation and positioning
A product's position is the way the product is defined by consumers on important attributes, the place it occupies in consumers' minds relative to competing products. Positioning involves implanting the brand's unique benefits and differentiation in customers' minds. Consumers simplify buying by mentally categorizing products, services and companies; a firm that does not plan its position leaves it to chance and to competitors.
To differentiate, a firm can use product differentiation (features, performance, style, design), services differentiation (speed, convenience, careful delivery, installation, support), channel differentiation (coverage, expertise, performance), people differentiation (better-trained, friendlier staff) and image differentiation (a brand image that conveys distinctive benefits). Not every difference is worth promoting. A difference is worth establishing if it is important to target buyers, distinctive, superior, communicable, pre-emptive (hard for competitors to copy), affordable for buyers and profitable for the firm.
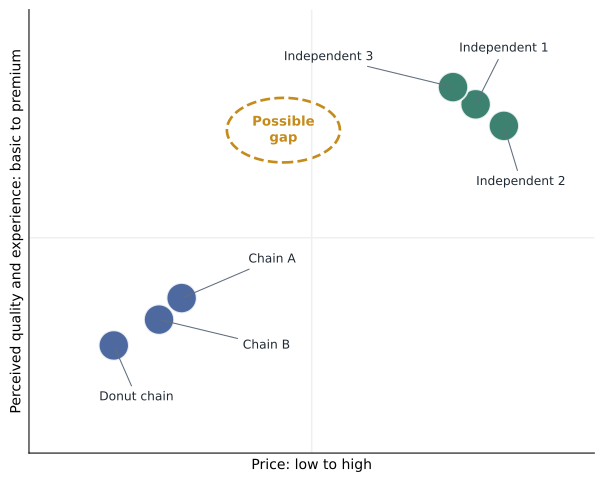
Marketers often draw perceptual positioning maps that show consumer perceptions of brands on two important buying dimensions. Maps based on research, rather than managers' assumptions, can reveal crowded spaces where many brands are perceived alike and gaps where customer needs are not well served. A gap is only an opportunity, though, if enough customers want what it represents.
Worked problem
Reading a perceptual map
A survey of 400 coffee drinkers in a city rates six coffee shops on price (1 = low, 10 = high) and perceived quality (1 = basic, 10 = premium). Two chains score about 3 on price and 4 on quality; a donut chain scores 2 and 3; three independent cafés score 8 or 9 on price and 8 or 9 on quality. A new café owner wonders whether to position at price 5 and quality 8. What should she check before deciding?
Show solution
- The map shows two clusters: low-price, basic chains and high-price, premium independents.
- The area around price 5 and quality 8 is empty, which suggests a possible gap: good coffee at a moderate price.
- She should check whether enough customers want this combination, for example by asking respondents to mark their ideal point.
- She should check whether the gap can be served profitably: can she buy and prepare high-quality coffee at a moderate price?
- She should check whether competitors could easily move into the space, for example if a chain upgrades its beans.
Answer: The map suggests a gap for affordable quality, but she needs evidence of demand, a cost structure that makes it profitable and a defensible difference before committing.
Value propositions and positioning statements
A brand's full positioning is called its value proposition: the full mix of benefits on which it is differentiated and positioned. A common way to frame it is to compare benefits and price. Winning positions include more for more (premium benefits at a higher price), more for the same (matching a competitor's price with better benefits), the same for less (a good deal on comparable quality), less for much less (fewer benefits at a much lower price, as with budget airlines) and more for less, the most attractive but hardest to sustain. Positions that offer less for more or the same for more tend to fail once customers realize they are overpaying.
| Value proposition | Benefits | Price | Example type |
|---|---|---|---|
| More for more | Higher | Higher | Luxury hotel, premium audio equipment |
| More for the same | Higher | Same | A challenger car brand with more standard features |
| The same for less | Same | Lower | A warehouse club or store brand |
| Less for much less | Lower | Much lower | A no-frills airline or discount gym |
| More for less | Higher | Lower | Hard to sustain; usually from a cost breakthrough |
A positioning statement summarizes company or brand positioning in a standard form: To (target segment and need), our (brand) is (concept) that (point of difference), because (reason to believe). For example: 'To busy parents of young children who want to cook healthy dinners without planning, FreshNest is the meal-kit service that delivers 20-minute family recipes picked by a nutritionist, because every recipe is tested with real families before it reaches the menu.' The statement first places the brand in a category, which establishes its points of parity with competitors, and then shows its point of difference.
Points of parity are attributes the brand shares with competitors that are necessary for credibility in the category; a meal kit must deliver fresh ingredients reliably. Points of difference are attributes customers strongly associate with the brand, evaluate positively and believe they could not find to the same extent with a competitor. Good positioning establishes parity where it must and difference where it matters.
Customer lifetime value revisited
Targeting decisions are better when the firm knows what a customer in each segment is worth. Lesson 1 used a simple version of customer lifetime value. A more careful version allows for the fact that only a share of customers stay each year (the retention rate) and that money received in the future is worth less than money received today (the discount rate). Assuming a constant annual margin m, a constant retention rate r and a discount rate i, and margins received at the end of each year, the expected lifetime value of a newly retained customer can be approximated by a simple formula.
Worked problem
Comparing segments by lifetime value
A home-insurance company compares two segments. Young renters generate $120 a year of margin with a 70 % annual retention rate. Homeowners aged 45 to 64 generate $200 a year with a 90 % retention rate. The company uses a 10 % discount rate, and acquiring a customer costs $150 in either segment. Calculate the CLV and the net value of a new customer in each segment.
Show solution
- Renters: CLV = 120 × 0.70 ÷ (1 + 0.10 − 0.70) = 84 ÷ 0.40 = $210.
- Homeowners: CLV = 200 × 0.90 ÷ (1 + 0.10 − 0.90) = 180 ÷ 0.20 = $900.
- Net value after acquisition cost: renters $210 − $150 = $60; homeowners $900 − $150 = $750.
- Raising renter retention to 80 % would lift their CLV to 96 ÷ 0.30 = $320, showing how sensitive CLV is to retention.
Answer: A homeowner is worth about $900 and a renter about $210. The company should still serve renters, who may later become homeowners, but should invest more to acquire and keep homeowners.
Common mistakes
MistakeSegmenting on variables that do not change what customers want.
InsteadTest segments against the criteria: measurable, accessible, substantial, differentiable and actionable.
MistakeChoosing the largest segment automatically.
InsteadWeigh size against competition, fit with company strengths and profitability.
MistakeTrying to be all things to all people.
InsteadChoose a clear target and a value proposition that stands out for those customers.
MistakePositioning on a difference customers do not care about.
InsteadPromote differences that are important, distinctive, superior, communicable, pre-emptive, affordable and profitable.
MistakeTreating every empty space on a perceptual map as an opportunity.
InsteadConfirm demand for the gap and the ability to serve it profitably.
MistakeUsing simple CLV that ignores retention and timing.
InsteadUse retention and discount rates; CLV is highly sensitive to retention.
Summary and key terms
- STP means segmenting the market, targeting attractive segments and positioning the offer in customers' minds.
- Consumer markets can be segmented by geographic, demographic, psychographic and behavioural variables; RFM scores existing customers.
- Useful segments are measurable, accessible, substantial, differentiable and actionable.
- Segments are evaluated on size and growth, structural attractiveness and fit with company objectives and resources.
- Targeting strategies range from undifferentiated to differentiated, concentrated and micromarketing.
- Positioning defines the place a brand occupies in customers' minds; perceptual maps reveal clusters and gaps.
- Value propositions such as more for more and the same for less compare benefits with price; positioning statements state target, category, difference and proof.
- CLV ≈ m × r ÷ (1 + i − r) allows segments to be compared by lifetime value.
- Market segmentation
- Dividing a market into distinct groups of buyers with different needs, characteristics or behaviours.
- Benefit segmentation
- Grouping buyers by the benefits they seek from a product.
- RFM analysis
- Scoring customers on recency, frequency and monetary value of purchases.
- Target market
- A set of buyers sharing common needs that the company decides to serve.
- Concentrated marketing
- Pursuing a large share of one or a few small segments or niches.
- Micromarketing
- Tailoring products and programs to specific individuals and local groups.
- Product position
- The place a product occupies in consumers' minds relative to competitors.
- Perceptual map
- A chart of consumer perceptions of brands on important buying dimensions.
- Value proposition
- The full mix of benefits on which a brand is differentiated and positioned.
- Point of difference
- An attribute customers associate strongly and favourably with a brand and believe competitors cannot match.
Practice problems
Work each problem on paper first, then reveal the answer to check.
Give an example of occasion segmentation.
Show answer
Marketing chocolates for Valentine's Day.
What does an RFM score of 144 suggest?
Show answer
A frequent, high-spending customer who has not bought recently; a win-back candidate.
Name the five requirements for effective segmentation.
Show answer
Measurable, accessible, substantial, differentiable, actionable.
A segment scores 7, 5, 9 with weights 0.4, 0.3, 0.3. What is its score?
Show answer
2.8 + 1.5 + 2.7 = 7.0.
Which targeting strategy suits a small firm with limited resources?
Show answer
Concentrated (niche) marketing.
What is the difference between a point of parity and a point of difference?
Show answer
Parity is needed for credibility in the category; difference is what makes the brand distinctive and preferred.
Which value proposition does a no-frills airline use?
Show answer
Less for much less.
Write a positioning statement for a campus food truck.
Show answer
Answers vary; it should state target, category, point of difference and reason to believe.
m = $100, r = 0.8, i = 0.1. What is CLV?
Show answer
80 ÷ 0.3 ≈ $267.
Portfolio task: draw a perceptual map for a category you buy and identify any gap.
Show answer
Answers vary; a good answer explains the axes and tests whether the gap is real.
Lesson quiz · 5 questions
Score 60% or more to complete this lesson.
Create a free account to save your progress, take quizzes and earn a certificate.