
CON-210 · Lesson 6 of 12 · 32 min
Probabilistic scheduling and schedule risk
A critical path schedule built with single durations gives a single finish date, and that date is almost certainly wrong. Not because the scheduler made a mistake, but because every duration is an estimate and every estimate is uncertain. Some activities will go faster than planned and some slower; weather, deliveries, inspections and productivity all vary. Probabilistic scheduling asks a more honest question: given the uncertainty in each activity, how likely is it that the project will finish by a given date, and which risks drive that likelihood? This lesson introduces the program evaluation and review technique (PERT), Monte Carlo schedule risk analysis, and the practical use of risk-adjusted schedules and contingency in construction.
Why single-point dates mislead
Suppose three activities in a row each have a most likely duration of 10 days, but each could take as little as 8 or as long as 16. The deterministic schedule shows 30 days. But the distributions are skewed: there is more room to run long than short, as anyone who has watched construction knows. The expected total is more than 30 days, and the chance of finishing in 30 days or less is well below one half.
A second effect makes things worse. When two or more paths merge into one activity, the merge activity can start only when the latest path finishes. Even if each path is equally likely to be early or late, the latest of several uncertain paths tends to be late. This is called merge bias, and it means that schedules with many parallel paths are more likely to overrun than their critical path alone suggests. A deterministic CPM calculation cannot show merge bias; probabilistic methods can.
Three-point estimates and the PERT formulas
PERT was developed in the late 1950s for the US Navy's Polaris missile program, where many activities had never been done before. It asks for three estimates for each activity: the optimistic duration \(a\), the most likely duration \(m\) and the pessimistic duration \(b\). Assuming the duration follows a beta distribution, PERT approximates the mean and standard deviation as follows.
For a path of activities in series, PERT adds the means to get the expected path duration and adds the variances (not the standard deviations) to get the path variance. By the central limit theorem, the total of several independent durations is approximately normally distributed, so the probability of finishing by a target date can be read from the standard normal distribution.
Worked problem
Probability of meeting a date with PERT
The critical path of a small project has three activities with three-point estimates in working days: excavation (a = 4, m = 5, b = 8), foundations (6, 8, 14) and framing (10, 12, 20). What is the expected duration of the path, and the probability of finishing within 30 working days?
Show solution
- Excavation: t = (4 + 20 + 8) ÷ 6 = 5.33; σ² = (4 ÷ 6)² = 0.444.
- Foundations: t = (6 + 32 + 14) ÷ 6 = 8.67; σ² = (8 ÷ 6)² = 1.778.
- Framing: t = (10 + 48 + 20) ÷ 6 = 13.00; σ² = (10 ÷ 6)² = 2.778.
- Path: T = 5.33 + 8.67 + 13.00 = 27.0 days; σ² = 0.444 + 1.778 + 2.778 = 5.0; σ = √5.0 = 2.24 days.
- z = (30 − 27.0) ÷ 2.24 = 1.34.
- From the standard normal table, P(z ≤ 1.34) ≈ 0.91.
Answer: Expected duration 27.0 days; about a 91 % chance of finishing within 30 days. The deterministic sum of most likely values, 25 days, has well under a 50 % chance.
| z | Probability of finishing by the target | z | Probability |
|---|---|---|---|
| −1.0 | 16 % | 0.5 | 69 % |
| −0.5 | 31 % | 1.0 | 84 % |
| 0.0 | 50 % | 1.28 | 90 % |
| 0.25 | 60 % | 1.645 | 95 % |
Worked problem
Setting a date with 90 % confidence
For the path in the previous example, what completion date gives about 90 % confidence?
Show solution
- For 90 % confidence, z ≈ 1.28.
- Target = T + z × σ = 27.0 + 1.28 × 2.24 = 29.9 days.
- Round up to 30 working days.
- The difference between the deterministic 25 days and the 90 % date of 30 days is a measure of the schedule contingency this path needs.
Answer: About 30 working days for 90 % confidence, 5 days more than the sum of the most likely durations.
Limitations of PERT
PERT is simple and teaches the right instincts, but it has well-known weaknesses. It analyses only one path, usually the deterministic critical path, and so ignores merge bias: a near-critical path with high uncertainty can easily become the controlling path. It assumes the activities are independent, when in construction they are often correlated: a wet spring slows excavation, foundations and site work together, and a weak superintendent slows everything. And it relies on three estimates that people find hard to give honestly, especially the pessimistic one. For these reasons PERT is now used mainly for teaching and quick checks, and Monte Carlo simulation is the standard tool for schedule risk analysis on significant projects.
Monte Carlo schedule risk analysis
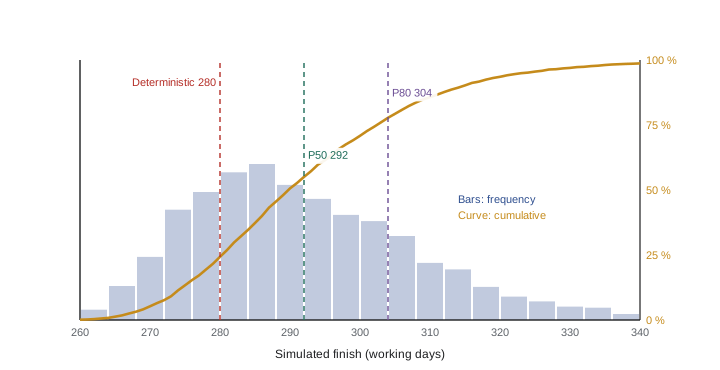
Monte Carlo simulation runs the whole schedule many times, often 1,000 to 10,000 iterations. In each iteration, the software picks a duration for every uncertain activity at random from its distribution, recalculates the critical path, and records the finish date and which activities were critical. The results are a probability distribution of the finish date, usually shown as a histogram with a cumulative curve, and a measure of how often each activity was critical, called the criticality index.
Because every iteration recalculates the whole network, Monte Carlo captures merge bias and shifting critical paths automatically. It can model correlation between activities, discrete risk events (such as a 30 % chance that a permit is delayed by 4 weeks), and different distributions, most commonly triangular, beta-PERT or uniform. AACE International's recommended practices describe several methods of schedule risk analysis, and many public owners require a probabilistic analysis on large projects.
Results are usually reported as percentile dates. The P50 date is the date with a 50 % chance of being met; the P80 or P90 date is often used for commitments and contingency. The spread between the deterministic date and the P80 date tells management how much schedule contingency is needed.
Worked problem
Reading Monte Carlo results
A Monte Carlo analysis of a 280-working-day schedule gives these results: P10 = 276 days, P50 = 292 days, P80 = 304 days, P90 = 311 days. The contract requires completion in 300 working days. Interpret the results.
Show solution
- The deterministic finish of 280 days lies between P10 and P50, so its probability of being met is low, roughly 20 to 30 %.
- The contract date of 300 days lies between P50 and P80, so the chance of meeting it is roughly 70 %.
- To reach 80 % confidence of meeting 300 days, the project must recover about 4 days of risk exposure, by mitigating the risks that drive the spread or by compressing critical work.
- Management should look at the criticality index and sensitivity results to find which activities and risks contribute most.
Answer: The contract date is achievable but with only about a 70 % chance; risk mitigation is needed to raise confidence.
Worked problem
A discrete risk event
Utility relocation must be finished before excavation can start. It is planned at 10 days, but there is a 30 % chance that the utility company will be late, adding 15 days. What is the expected duration of the relocation, and why is the expected value alone not enough?
Show solution
- Expected delay: 0.30 × 15 = 4.5 days.
- Expected duration: 10 + 4.5 = 14.5 days.
- But the actual outcome is either 10 days (70 %) or 25 days (30 %); it will never be 14.5.
- A Monte Carlo model represents the event as a 30 % branch, so the finish date distribution shows the real chance of a 15-day hit, which matters for liquidated damages and planning.
Answer: Expected duration 14.5 days, but the risk is lumpy: a 30 % chance of 25 days. Model it as a discrete event, not an average.
Risk registers and the schedule
Schedule risk analysis is most useful when it is tied to the project's risk register, the list of identified risks with their likelihood, impact, owners and responses. Risks that affect time are mapped to the activities they would delay. The analysis then shows which risks matter most to the finish date, and the team can compare the cost of a response with the reduction in schedule risk it buys.
| Risk | Likelihood | Impact if it occurs | Activities affected | Response |
|---|---|---|---|---|
| Late steel shop drawing approval | 40 % | +10 days | Steel fabrication | Early consultant workshops |
| Unknown soil conditions | 25 % | +15 days | Excavation, footings | Additional boreholes before tender |
| Winter weather worse than normal | 30 % | +8 days | Envelope, roofing | Heated hoarding allowance |
| Utility connection delay | 35 % | +20 days | Permanent power, commissioning | Early application, temporary generator |
| Labour shortage in electrical trade | 20 % | +12 days | Rough-in, trim-out | Early subcontract award |
Schedule contingency
Contingency is time held in reserve for risks. It can be held in several ways, and the choice matters for transparency and for float ownership.
- A visible contingency activity placed near the end of the schedule, before the contract completion milestone, so everyone can see it and its consumption can be tracked.
- Contingency buffers at the end of each phase or before key milestones, as in critical chain project management.
- Hidden padding in individual activity durations, which is generally poor practice because it is invisible, is consumed unconsciously and makes the critical path unreliable.
Contracts often regulate contingency. Some prohibit contractor contingency activities in the baseline because they look like float the contractor is claiming for itself; others allow or require them. Whatever the rule, the amount should be based on analysis, such as the gap between the deterministic and P80 dates, not on habit.
Worked problem
Sizing a contingency from Monte Carlo
The deterministic schedule for a project finishes on working day 410. Monte Carlo analysis gives P50 = 424 and P80 = 438. Management wants 80 % confidence in the date it reports to the owner. How much contingency should be shown, and where?
Show solution
- Contingency needed: P80 − deterministic = 438 − 410 = 28 working days.
- Show it as a single visible contingency activity of 28 days between the last construction activity and the reported completion milestone, if the contract allows.
- Report the deterministic forecast, the P50 and the P80 dates in each update, and track how much contingency has been used.
- If the contract completion date is earlier than day 438, the team knows it needs risk mitigation, not just optimism.
Answer: 28 working days of visible contingency, tracked in every update.
Making probabilistic thinking practical
Many construction schedules never receive a formal Monte Carlo analysis, and that is acceptable on simpler projects. The thinking still applies. A planner can identify the ten or twenty most uncertain activities, ask the people responsible for honest ranges, look for near-critical paths that merge before key milestones, and judge whether the stated completion date is realistic. Saying that the schedule shows an 80-day finish but the team believes there is only an even chance of meeting it is more useful to an owner than a confident date that everyone privately doubts.
Common mistakes
MistakeAssuming the deterministic finish date is likely to be met.
InsteadRecognize skewed durations and merge bias; estimate the probability of the date.
MistakeAdding standard deviations along a path.
InsteadAdd variances, then take the square root.
MistakeAnalysing only the deterministic critical path.
InsteadUse Monte Carlo to capture near-critical paths and merge bias.
MistakeAveraging discrete risks into activity durations.
InsteadModel risk events as branches with a probability and impact.
MistakeHiding contingency in activity durations.
InsteadShow contingency visibly and size it from analysis.
Summary and key terms
- Every duration is uncertain; single-point dates hide the uncertainty.
- Skewed durations and merge bias make overruns more likely than the deterministic schedule suggests.
- PERT uses \(t = (a + 4m + b)/6\) and \(\sigma = (b - a)/6\), adding means and variances along a path.
- The probability of meeting a date comes from \(z = (T_{\text{target}} - T_e)/\sigma_T\).
- Monte Carlo simulation recalculates the whole network many times and reports percentile dates.
- Risk registers link identified risks to the activities they would delay.
- Contingency should be visible, analysed and tracked.
- PERT
- Program evaluation and review technique; uses three-point estimates to estimate path durations and probabilities.
- Optimistic duration
- The shortest realistic duration if everything goes well.
- Pessimistic duration
- The longest realistic duration if things go badly, excluding catastrophes.
- Merge bias
- The tendency for activities where several uncertain paths join to start late.
- Monte Carlo simulation
- Repeated random sampling of activity durations to find the distribution of project outcomes.
- P80 date
- A date with an 80 % chance of being met.
- Criticality index
- The percentage of simulation iterations in which an activity was critical.
- Risk register
- A list of identified risks with likelihood, impact, owner and response.
- Schedule contingency
- Time held in reserve to absorb risks.
- Correlation
- A tendency for activity durations to vary together, for example from a shared cause.
Practice problems
Work each problem on paper first, then reveal the answer to check.
a = 6, m = 8, b = 16. What is the PERT mean?
Show answer
(6 + 32 + 16) ÷ 6 = 9.0 days.
For the same activity, what is σ?
Show answer
(16 − 6) ÷ 6 = 1.67 days.
Two activities have variances 4 and 5. What is the path standard deviation?
Show answer
√9 = 3 days.
T = 50, σ = 4. What is the probability of finishing within 54 days?
Show answer
z = 1.0, about 84 %.
What z value gives 95 % confidence?
Show answer
About 1.645.
What is merge bias?
Show answer
When uncertain paths merge, the latest one controls, so the merge point tends to be late.
Why is Monte Carlo preferred to PERT on large projects?
Show answer
It analyses the whole network, captures merge bias and shifting critical paths, and models correlation and risk events.
A 20 % chance of a 10-day delay: what is the expected delay?
Show answer
2 days, but the outcome is either 0 or 10 days.
Deterministic finish day 200, P80 day 214. Suggested contingency?
Show answer
14 working days.
Why is hidden padding poor practice?
Show answer
It is invisible, is used up unconsciously and makes the critical path unreliable.
Lesson quiz · 5 questions
Score 60% or more to complete this lesson.
Create a free account to save your progress, take quizzes and earn a certificate.