
CON-210 · Lesson 7 of 12 · 33 min
Resource loading and levelling
A critical path calculation assumes that every activity can start the moment its logic allows, with whatever crews and equipment it needs. Real projects do not work that way. A contractor has a limited number of carpenters, one tower crane, two concrete pumps booked on alternate days, and a site with room for a certain number of trades at once. Resource loading attaches the crews, equipment and other resources to each activity, so the schedule can show how many of each are needed day by day. Resource levelling then adjusts the timing of activities, usually within their float, to keep resource demand within limits or to smooth out peaks and valleys. This lesson covers both, with the hand methods every scheduler should understand.
What resources are
In scheduling, a resource is anything with limited availability that an activity needs. Construction schedules typically load:
- Labour, by trade or crew: carpenters, ironworkers, electricians, labourers.
- Major equipment: tower cranes, mobile cranes, hoists, concrete pumps, excavators.
- Space and access: work areas, laydown, hoist time, road closures.
- Materials with constrained supply, such as precast deliveries per day.
- Money, as a cost-loaded schedule that shows expenditure over time.
Not every resource needs to be loaded. Loading every labourer and every pickup truck makes the schedule complicated without improving decisions. Good practice is to load the resources that are scarce, expensive or shared between activities: the ones whose limits could change the plan.
The resource histogram
Once resources are attached to activities, the schedule can total the demand for each resource in each time period. Plotted as a bar chart against time, the result is a resource histogram. It shows at a glance when the project needs the most workers or equipment, how fast it builds up and runs down, and whether demand exceeds what is available. A cumulative curve of the same data, usually S-shaped, shows total labour-hours or cost over time and becomes the baseline for measuring progress.
Histograms are drawn from the early-start schedule unless stated otherwise. Because non-critical activities can move within their float, the same network can produce very different histograms depending on when those activities are scheduled. That flexibility is what levelling uses.
Worked problem
Building a histogram
Four activities share a crew of carpenters. Their early-start timing and crew sizes are: A, days 1 to 4, 4 carpenters, critical; B, days 1 to 3, 3 carpenters, 5 days of total float; C, days 5 to 10, 5 carpenters, critical; D, days 3 to 6, 4 carpenters, 4 days of total float. Build the daily histogram and find the peak and total demand.
Show solution
- Day 1: A 4 + B 3 = 7. Day 2: 7.
- Day 3: A 4 + B 3 + D 4 = 11.
- Day 4: A 4 + D 4 = 8.
- Days 5 and 6: C 5 + D 4 = 9.
- Days 7 to 10: C 5 = 5.
- Peak: 11 carpenters on day 3. Total: 7 + 7 + 11 + 8 + 9 + 9 + 5 × 4 = 71 carpenter-days.
- Average over 10 days: 7.1 carpenters, so the peak is more than 50 % above the average.
Answer: Peak of 11 on day 3; 71 carpenter-days in total; an uneven profile.
Two kinds of levelling problem
Resource levelling covers two related problems.
- Resource smoothing, sometimes called time-constrained levelling: the project finish date is fixed, and activities are moved only within their float to make demand as even as possible. The duration does not change.
- Resource-constrained scheduling, or resource-limited levelling: there is a hard limit on a resource, such as one crane or eight electricians, and activities are delayed as needed to stay within it, even if that extends the project.
Smoothing improves efficiency: a steady crew is cheaper and more productive than one that is hired, laid off and rehired. Resource-constrained scheduling is about feasibility: a schedule that needs two tower cranes on a site with room for one is not a schedule at all.
Smoothing within float
A simple manual approach to smoothing is to start with the early-start schedule, then try moving non-critical activities later within their float, one at a time, choosing moves that reduce the peak or make the profile flatter. A useful measure of smoothness is the sum of the squares of daily demand: for the same total, a flatter profile has a smaller sum of squares.
Worked problem
Smoothing the carpenter histogram
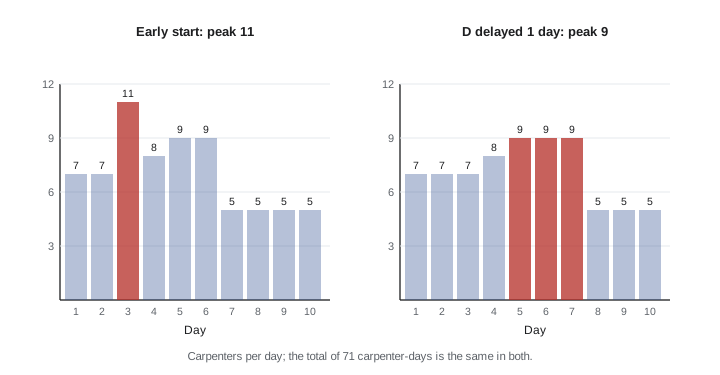
Using the four activities from the previous example, compare two options: delay D by 1 day (days 4 to 7) or delay D by 4 days (days 7 to 10). Which gives the smoother profile, and what is the peak in each case?
Show solution
- Original sum of squares: 49 + 49 + 121 + 64 + 81 + 81 + 25 × 4 = 545.
- D delayed 1 day: daily demand 7, 7, 7, 8, 9, 9, 9, 5, 5, 5; peak 9; sum of squares 49 × 3 + 64 + 81 × 3 + 25 × 3 = 529.
- D delayed 4 days: daily demand 7, 7, 7, 4, 5, 5, 9, 9, 9, 9; peak 9; sum of squares 49 × 3 + 16 + 25 × 2 + 81 × 4 = 537.
- Both moves cut the peak from 11 to 9 and keep the 10-day duration, because D had 4 days of float.
- Delaying D by 1 day gives the lower sum of squares and so the smoother profile, and it keeps 3 days of D's float in reserve.
Answer: Delay D by 1 day: peak 9, smoothest profile, and some float kept for later.
Software uses rules of the same kind, often called heuristics, to decide which activity to delay when resources conflict: activities with the least float first, activities with the earliest late start, or activities that use the most of the scarce resource. Different rules give different results, so the scheduler must check the outcome rather than accept it blindly.
Resource-constrained scheduling
When a resource has a hard limit, levelling may have to extend the project. The usual heuristic, in hand calculations and many software tools, works period by period: at each time, list the activities whose logic allows them to start, and give the scarce resource to the activities with the least total float (or another priority rule), delaying the rest until resources free up.
Worked problem
One tower crane
Two activities both need the site's only tower crane full time: structural steel erection, 8 days, critical, ready to start on day 20; and precast stair installation, 3 days, with 5 days of total float, also ready on day 20. How should the crane be allocated, and what happens to the project duration?
Show solution
- Both activities need the single crane from day 20, so they cannot run together.
- Priority by least float: steel erection (0 days of float) gets the crane first, days 20 to 28.
- Stairs start when the crane is free: days 28 to 31, an 8-day delay.
- Stairs had only 5 days of float, so the 8-day delay uses all of it and 3 more: the project finish moves 3 days later, unless the stairs can be set by a mobile crane or fitted into crane gaps during steel erection.
- The resource conflict has created a new critical path through the crane, sometimes called a resource-critical path.
Answer: Steel first, stairs second; the project slips 3 days unless another crane or a different sequence is found.
The example shows a key point: once resources are levelled, the critical path is no longer just a matter of logic. Activities linked by nothing but a shared crane or crew can become critical together. Schedulers sometimes add resource logic explicitly, linking the activities in the order the crew will do them, so that the dependency is visible to everyone who reads the schedule.
Crane and hoist planning
On multi-storey building sites, the tower crane is often the controlling resource. A crane can make only so many lifts per hour, and every trade wants it at the start of the day. Planners estimate crane hours from the number of picks and the cycle time of each, and draw up a crane schedule by day or half-day. Personnel and material hoists on taller buildings raise the same issue later in the job, when hundreds of workers and tonnes of material must move vertically every morning.
Worked problem
Estimating crane time
A floor of a concrete-framed building needs 140 crane picks: formwork, reinforcing bundles, embedded items and concrete buckets on days when the pump is not used. The average cycle, including rigging, hoisting, landing and returning, is 8 minutes. The crane is available for 9 hours a day, and about 75 % of that time is productive after allowing for wind, inspections and waiting. How many crane-days does the floor need?
Show solution
- Total crane time: 140 × 8 min = 1,120 min = 18.7 hours.
- Productive hours per day: 9 × 0.75 = 6.75 hours.
- Crane-days: 18.7 ÷ 6.75 = 2.8, so about 3 crane-days per floor.
- If the target cycle is one floor every 5 working days, the crane is busy about 60 % of the time on frame work alone, leaving room for other trades but not for much more.
Answer: About 3 crane-days per floor; crane capacity supports a 5-day floor cycle with some margin.
Cost loading and cash flow
When each activity carries its budgeted cost, the schedule can produce a cost curve: the planned cumulative cost against time. Owners use it to plan funding and draws on construction loans; contractors use it to forecast billings and working capital; and it becomes the baseline for earned value analysis. The shape is usually an S-curve: slow at the start, steep in the middle when many trades are working at once, and flattening at the end during finishes and commissioning.
The early-start schedule gives the steepest curve and the late-start schedule the flattest, and the area between them shows the range of feasible spending patterns. A contractor wanting to delay costs might favour late starts; an owner wanting early progress might press for early starts. Most real projects fall somewhere between.
Worked problem
A simple cost curve
A project has three activities: A costs $120,000 over months 1 to 3; B costs $300,000 over months 2 to 5; C costs $180,000 over months 5 to 6. Assume each activity's cost is spread evenly over its months. Calculate monthly and cumulative planned cost.
Show solution
- A: $40,000 per month in months 1, 2 and 3.
- B: $75,000 per month in months 2, 3, 4 and 5.
- C: $90,000 per month in months 5 and 6.
- Monthly: M1 $40,000; M2 $115,000; M3 $115,000; M4 $75,000; M5 $165,000; M6 $90,000.
- Cumulative: $40,000; $155,000; $270,000; $345,000; $510,000; $600,000.
Answer: Planned cumulative cost reaches $600,000 at month 6, with the steepest month in month 5.
Practical levelling
Automatic levelling in scheduling software is powerful but can produce strange results: activities split into fragments, critical work delayed in favour of non-critical work, or durations stretched far beyond what anyone expected. Good practice is to level selectively: level only the genuinely scarce resources, review every change the software makes, and record the results in the schedule as logic or as documented decisions so the reasons are visible. Superintendents often level by experience, adjusting crew sizes and moving trades between areas each week. The schedule should reflect those decisions rather than fight them.
Levelling also interacts with productivity. A trade that can work continuously, moving from area to area without waiting, works more efficiently than one that starts, stops and remobilizes. Schedules that keep key trades working continuously, a principle developed further in location-based scheduling in Lesson 9, often finish sooner and cost less than schedules that start every activity as early as possible.
Common mistakes
MistakeAssuming the early-start schedule is always feasible.
InsteadLoad scarce resources and check demand against availability.
MistakeLoading every minor resource.
InsteadLoad the scarce, expensive or shared resources whose limits affect the plan.
MistakeAccepting automatic levelling results without review.
InsteadCheck each change and document the reasons in the schedule.
MistakeForgetting that levelling can create new critical paths.
InsteadLook for resource-driven critical paths and show resource logic explicitly.
MistakeIgnoring crane and hoist capacity on tall buildings.
InsteadEstimate picks and cycle times and plan crane time by slot.
Summary and key terms
- Resource loading attaches labour, equipment, space or cost to activities.
- A resource histogram shows demand per period; a cumulative curve shows totals over time.
- Smoothing moves activities within float to flatten demand without changing the finish date.
- Resource-constrained scheduling delays activities to respect hard limits, which may extend the project.
- Least total float is a common priority rule for allocating scarce resources.
- Cranes and hoists are often the controlling resources on building sites.
- Cost-loaded schedules produce S-curves for funding, billing and earned value.
- Resource
- Labour, equipment, space, material or money with limited availability needed by activities.
- Resource loading
- Assigning resource quantities to schedule activities.
- Resource histogram
- A bar chart of resource demand per time period.
- Resource smoothing
- Adjusting activities within float to even out resource demand without extending the project.
- Resource-constrained scheduling
- Scheduling within hard resource limits, which may extend the project.
- Priority rule
- A rule for deciding which activity gets a scarce resource first.
- Resource-critical path
- A chain of activities that controls the finish because of resource limits rather than logic.
- Crane pick
- A single lift by a crane.
- Cost-loaded schedule
- A schedule in which activities carry budgeted costs.
- S-curve
- The cumulative cost or work curve of a project, typically S-shaped.
Practice problems
Work each problem on paper first, then reveal the answer to check.
Name three resources a building schedule might load.
Show answer
Any three of: trades or crews, tower crane, hoist, concrete pump, space, money.
What is the difference between smoothing and resource-constrained scheduling?
Show answer
Smoothing keeps the finish date and uses float; resource-constrained scheduling respects limits even if the finish moves.
Daily demands of 6, 6, 6 and 2, 10, 6 have the same total. Which is smoother?
Show answer
6, 6, 6: sum of squares 108 versus 140.
Two activities need one crane; one has 0 float, one has 6. Which gets it first by the least-float rule?
Show answer
The one with zero float.
An activity with 4 days of float is delayed 7 days by a resource conflict. Effect on the finish?
Show answer
The finish moves 3 days later unless the conflict is resolved another way.
A floor needs 90 picks at 10 minutes each. How many hours of crane time?
Show answer
15 hours.
Why is a steady crew more efficient than a fluctuating one?
Show answer
It avoids hiring, layoff and remobilization costs and keeps learning on the job.
Why is a cost curve usually S-shaped?
Show answer
Spending is slow at the start, fastest when many trades work at once, and slow during finishes and commissioning.
Which schedule gives the steepest cost curve?
Show answer
The early-start schedule.
What should a scheduler do after running automatic levelling?
Show answer
Review each change, check the critical path and document the decisions.
Lesson quiz · 5 questions
Score 60% or more to complete this lesson.
Create a free account to save your progress, take quizzes and earn a certificate.