
CON-305 · Lesson 8 of 12 · 27 min
Daily and weekly planning and managing productivity
A superintendent who plans well spends the day solving tomorrow's problems; one who does not spends it solving today's, usually at a higher cost. This lesson looks at the supervisor's planning horizon, from the week to the next shift, and at how supervisors measure and manage the productivity of the crews they lead. It builds on the scheduling methods of CON-210, the look-ahead and short-interval planning of CON-335, the lean make-ready and Last Planner tools of CON-410 and the cost control and earned value methods of CON-310. Here the focus is on what a superintendent or foreman actually does each afternoon to make tomorrow work, and how they know whether the crew is on track.
Levels of planning
Construction planning works at several levels of detail. The master schedule shows the whole project in months and milestones. Phase plans break major phases, such as the podium structure or the wood frame, into sequences. The look-ahead schedule, usually three to six weeks, shows the activities coming up in enough detail to identify and remove constraints. The weekly work plan lists what each crew will actually do next week. The daily plan assigns people, equipment and materials to tasks for tomorrow. Each level feeds the next: a weekly plan that ignores the look-ahead produces surprises, and a look-ahead that ignores what crews actually achieve produces fantasy.
Superintendents own the lower levels. On Larkspur Commons, Priya maintains the master schedule with Thornbury's scheduler; Dana and Omar maintain the three-week look-ahead; the foremen commit to the weekly work plan at the coordination meeting (lesson 7); and each foreman plans the next day with Dana's help. The single most useful habit at the daily level is to plan tomorrow today, usually in the early afternoon, while there is still time to fix what is missing.
Is the work ready?
Work can only proceed efficiently when everything it needs is in place. Lean construction calls this making work ready (CON-410). A supervisor planning tomorrow should run through the same checklist for every crew.
| Prerequisite | Question to ask the afternoon before | Larkspur Commons example |
|---|---|---|
| Information | Are drawings current, RFIs answered, layout done? | Is the revised beam pocket detail on the tablets? |
| Materials | Are materials on site, at the workface, the right quantity? | Are level 5 wall panels staged by the hoist? |
| Equipment and tools | Is the crane, hoist, lift or tool booked and working? | Is the boom lift charged and inspected? |
| Labour | Is the right crew, with the right skills and tickets, available? | Is a certified scaffolder on the crew for the stair tower? |
| Prerequisite work | Is the previous trade finished and inspected? | Has plumbing rough-in on level 4 passed inspection before insulation? |
| Space | Is the area clear, with no other trades stacked in it? | Will the drywall stockers and electricians both be in units 401 to 406? |
| Permits and inspections | Are permits issued, inspections booked, hold points cleared? | Is the hot work permit ready for the roof membrane? |
| Safe conditions | Are guardrails, access, lighting and protection in place? | Are the stair guardrails installed before the stair opens? |
| Weather | Will forecast conditions allow the work and safe working? | Is wind forecast above the crane limit for tomorrow afternoon? |
If a prerequisite is missing, the supervisor has three choices: fix it before tomorrow, move the crew to other ready work (which is why a buffer of ready backlog work is valuable) or accept the loss knowingly. What experienced supervisors avoid is discovering the gap at 7 a.m. with the crew standing around.
Sizing and balancing crews
Crew size affects productivity in ways that are not linear. Too small a crew may be unable to perform tasks that need several people, such as lifting wall panels or placing concrete. Too large a crew crowds the work area, waits for the bottleneck task and loses time to coordination. Most tasks have an optimum crew composition, a balance of skilled workers, apprentices and labourers, where each person is fully used. A formwork crew that has four carpenters and one labourer may have carpenters carrying material; one with two carpenters and four labourers may have labourers waiting for the carpenters.
Adding workers to a late task does not reduce its duration proportionally. Fred Brooks observed in software that adding people to a late project can make it later, because new people need orientation and coordination grows. Construction shows the same effect: doubling a framing crew on one floor rarely doubles its output, because of congestion, shared equipment and supervision limits. Lesson 6 showed that communication channels grow as \(n(n-1)/2\); a foreman's ability to supervise effectively usually limits a crew to somewhere around six to twelve people, depending on the work.
Worked problem
Sizing a crew for a deadline
Ben's formwork crew must form 960 m² of podium walls in 8 working days to hold the pour schedule. The estimate assumed 0.40 worker-hours per m² of contact area, and the crew of 8 carpenters and labourers has been achieving about that rate. Should Dana add workers?
Show solution
- Check the units first. The rate is in worker-hours, not crew-hours, per unit of contact area. Mixing the two is a common and expensive error: read as crew-hours, the same number would suggest the job needs eight times as long.
- Hours needed: 960 × 0.40 = 384 worker-hours.
- Hours available per day: a crew of 8 working 8-hour days provides 64 worker-hours, so the work needs 384 / 64 = 6 days.
- Six days is within the 8 available, leaving 2 days of float for weather, crane delays or problems. No extra workers are needed; the priority is protecting the crew's productivity by keeping material and crane time flowing.
Answer: The crew can meet the deadline with float to spare. Adding workers would have added cost and congestion for no benefit. Always check the units of a productivity rate before acting on it.
Measuring productivity on the crew
Supervisors need a simple, frequent way to know whether a crew is producing at the rate the budget assumed. The usual method uses earned hours. Each work item has a budgeted unit rate from the estimate, such as 0.40 worker-hours per square metre of wall formwork. Each day or week, the installed quantity is measured and multiplied by the unit rate to give earned hours: the hours the budget allowed for the work actually done. Comparing earned hours with the actual hours charged gives a productivity factor.
A PF above 1.0 means the crew is doing better than the budget; below 1.0 means worse. (Some companies define the ratio the other way round, as actual over earned, so check which convention your company uses.) CON-410 discusses productivity measurement more broadly and CON-310 links earned hours to earned value and cost forecasting. For the supervisor, the value is in the trend and the conversation: a PF that drops from 1.05 to 0.82 over three days is a signal to go and look at what changed.
The worked example tracks a week of Ben's crew on two work items, wall formwork and column formwork.
# Daily earned hours and productivity factor for a self-performed formwork crew (illustrative data)
rates = {"wall forms": 0.40, "column forms": 1.10}   # budgeted worker-hours per m2 of contact area
days = [  # day, actual worker-hours charged, {item: m2 installed}
    ("Mon", 64, {"wall forms": 150, "column forms": 6}),
    ("Tue", 64, {"wall forms": 165, "column forms": 4}),
    ("Wed", 64, {"wall forms": 120, "column forms": 5}),   # crane down 2 h for repair
    ("Thu", 72, {"wall forms": 120, "column forms": 6}),   # one extra worker added
    ("Fri", 64, {"wall forms": 159, "column forms": 5}),
]
cum_e = cum_a = 0
for day, actual, qty in days:
    earned = sum(q * rates[k] for k, q in qty.items())
    cum_e += earned; cum_a += actual
print(f"{day}: earned {earned:5.1f} h actual {actual:3d} h PF {earned/actual:4.2f} cumulative PF {cum_e/cum_a:4.2f}")Mon: earned 66.6 h actual 64 h PF 1.04 cumulative PF 1.04 Tue: earned 70.4 h actual 64 h PF 1.10 cumulative PF 1.07 Wed: earned 53.5 h actual 64 h PF 0.84 cumulative PF 0.99 Thu: earned 54.6 h actual 72 h PF 0.76 cumulative PF 0.93 Fri: earned 69.1 h actual 64 h PF 1.08 cumulative PF 0.96
Monday and Tuesday ran close to or better than budget. Wednesday dropped sharply because the crane was down for two hours, a cause outside the crew's control that Dana records in the daily report. Thursday is the interesting day: Ben added a worker to catch up and productivity fell further, probably because the extra person was new to the crew and needed direction while the crew was also working around the delayed material from Wednesday. Friday recovered. The cumulative PF of about 0.96 for the week is slightly below budget but not alarming. Without the daily numbers, Dana would only have known that the week felt rough.
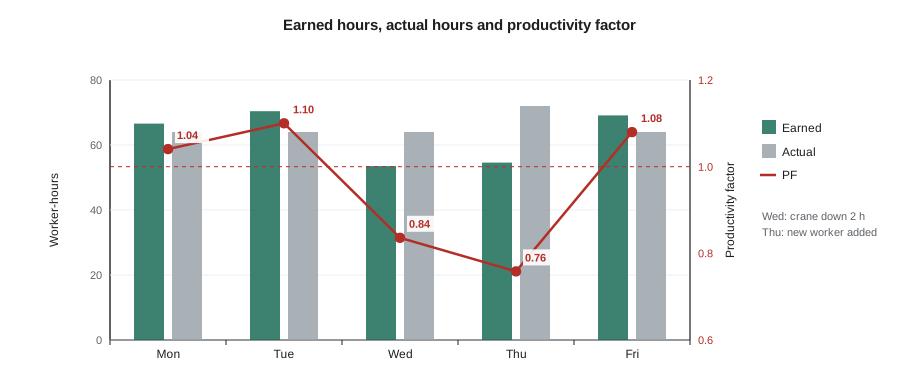
Measurement only helps if the quantities are honest and the response is constructive. Crews that see productivity numbers used to blame them will find ways to inflate quantities. Crews that see numbers used to identify and remove obstacles, such as late material, crane conflicts and missing information, tend to support measurement. Productivity tracking is a tool for the supervisor to manage the system, not a stick.
What drives productivity on site
Studies of construction productivity, from activity sampling in the 1970s to recent sensor-based research, consistently find that a large share of a typical tradesperson's day is not spent on direct installation work. Time goes to waiting for materials, equipment or instructions, travelling to and from the work area, searching for tools and information, rework and breaks. The share of direct work varies widely by trade, project and study method, so be careful with any single figure, but the consistent message is that most productivity gains come from removing these losses rather than from asking people to work faster.
| Factor | Effect on productivity | Supervisor response |
|---|---|---|
| Waiting for materials or information | Idle time; crews moved to less important work | Make work ready; plan tomorrow today |
| Trade stacking and congestion | Interference, double handling, safety risk | Sequence trades by area; limit trades per floor |
| Rework | Paying twice for the same work | Clear instructions, inspections at hold points (CON-345) |
| Changes and disruptions | Lost learning, restarts, demobilization | Protect crews from churn; record disruptions (CON-420) |
| Weather | Slower work, safety limits, protection costs | Watch forecasts; plan weather-sensitive work and protection |
| Learning curve | First units slow, later units faster | Keep crews together on repetitive work; plan mock-ups |
| Sustained overtime and fatigue | Lower output per hour, more errors and injuries | Use overtime sparingly and in short bursts |
Overtime and fatigue
When a project falls behind, extended hours are the obvious response. For short periods, overtime can recover time effectively. Sustained overtime is different. Several industry studies have found that productivity per hour falls as scheduled overtime continues for weeks, so that the extra hours buy much less than they cost. Frequently cited sources include a 1980 Business Roundtable report on scheduled overtime, guidance published by the Mechanical Contractors Association of America and the National Electrical Contractors Association, and later academic research by Awad Hanna and colleagues. The studies differ in methods and results, and their curves are estimates for typical conditions rather than laws, but they agree on the direction: the longer and heavier the overtime, the greater the loss.
Fatigue also raises safety risk. Research on working hours across industries has found higher injury risk with long shifts and long weeks, and tired workers make more errors in judgement. Superintendents should treat sustained overtime as a decision with safety as well as cost consequences, consider alternatives such as a second shift or additional crews in other areas, and watch for signs of fatigue.
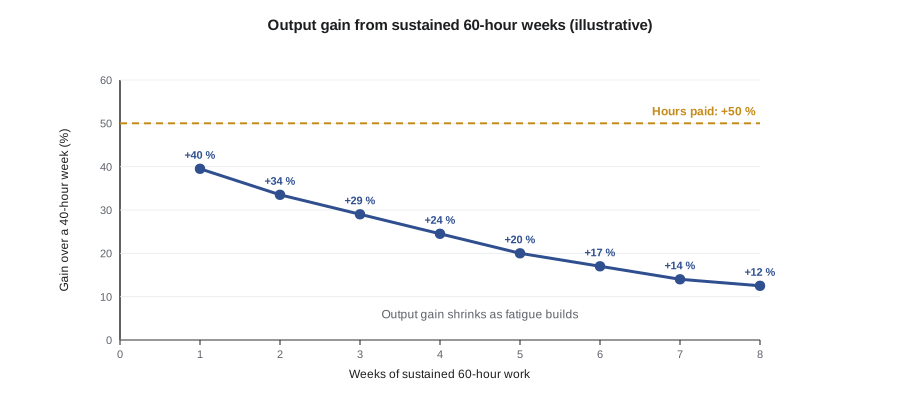
The worked example uses an illustrative productivity loss curve, loosely shaped like the published studies but not taken from any one of them, to show why sustained overtime disappoints.
# Illustrative effect of sustained 60-hour weeks (6 x 10 h) on a crew's output.
# Efficiency factors are ILLUSTRATIVE ONLY, shaped like published industry curves, not data.
eff_60h = [0.93, 0.89, 0.86, 0.83, 0.80, 0.78, 0.76, 0.75]   # week 1..8 relative to a 40-h week
crew, base_rate = 10, 1.0      # output units per worker-hour at 40 h/week
ot_premium = 1.5               # overtime paid at time and a half
wage = 50.0                    # $/h straight time

tot_40 = tot_60 = cost_40 = cost_60 = 0
for wk, e in enumerate(eff_60h, 1):
    out40 = crew * 40 * base_rate
    out60 = crew * 60 * base_rate * e
    tot_40 += out40; tot_60 += out60
    cost_40 += crew * 40 * wage
    cost_60 += crew * (40 * wage + 20 * wage * ot_premium)
    print(f"week {wk}: 60-h output {out60:5.0f} vs 40-h {out40:4.0f}  gain {out60/out40-1:+.0%}")
print(f"8 weeks: hours +50 %, output +{tot_60/tot_40-1:.0%}, wage cost +{cost_60/cost_40-1:.0%}")
print(f"Cost per unit: 40 h ${cost_40/tot_40:.2f} 60 h ${cost_60/tot_60:.2f}")week 1: 60-h output 558 vs 40-h 400 gain +40% week 2: 60-h output 534 vs 40-h 400 gain +34% week 3: 60-h output 516 vs 40-h 400 gain +29% week 4: 60-h output 498 vs 40-h 400 gain +25% week 5: 60-h output 480 vs 40-h 400 gain +20% week 6: 60-h output 468 vs 40-h 400 gain +17% week 7: 60-h output 456 vs 40-h 400 gain +14% week 8: 60-h output 450 vs 40-h 400 gain +12% 8 weeks: hours +50 %, output +24%, wage cost +75% Cost per unit: 40 h $50.00 60 h $70.71
Under these illustrative assumptions, working 50 % more hours for eight weeks buys only about 24 % more output while labour cost rises by 75 %, so each unit of work costs about 40 % more. In the first week the gain is about 40 %; by the eighth it has shrunk to about 12 %. The real figures depend on the trade, the work, the conditions and the crew, but the pattern explains why experienced superintendents use overtime in short bursts for specific goals, such as closing in a floor before winter, rather than as a standing schedule.
Visual management and the daily report
Plans work best when everyone can see them. Many superintendents keep a large look-ahead and floor plan on the wall of the site office or at the coordination area, marked by area and trade, with constraints flagged and completed work coloured in. Crews can see where they stand and what is coming. Digital boards on site screens or tablets do the same job. Simple visuals, such as a daily production board at the workface showing target and actual, can help crews track their own progress.
The daily report closes the loop between plan and reality. It records what was planned, what was done, who was on site, what went wrong and why. Those records feed tomorrow's plan, the next look-ahead update and, if things go badly, the evidence in a delay or productivity claim (CON-420). CON-375 covers daily reports in detail.
Common mistakes
MistakePlanning tomorrow's work at 6:30 tomorrow morning.
InsteadPlan tomorrow the afternoon before, using a readiness checklist, while there is time to fix gaps.
MistakeAdding workers to a late task and expecting output to rise in proportion.
InsteadCheck crew balance, space and supervision limits; extra workers often add congestion and coordination.
MistakeActing on a productivity rate without checking its units.
InsteadConfirm whether the rate is per worker-hour or crew-hour, per unit or per hundred units, before calculating.
MistakeUsing productivity numbers to blame crews.
InsteadUse them to find and remove obstacles, so that crews support honest measurement.
MistakeScheduling sustained overtime as a standing recovery plan.
InsteadUse overtime in short bursts for specific goals and consider extra crews or shifts; watch fatigue and safety.
Summary and key terms
- Planning runs from the master schedule through phase plans and look-aheads to weekly and daily plans; supervisors own the lower levels.
- Plan tomorrow today, checking information, materials, equipment, labour, prerequisite work, space, permits, safe conditions and weather.
- Crews have an optimum composition; adding workers to late work rarely increases output in proportion.
- Earned hours equal installed quantity times budgeted unit rate; the productivity factor compares earned with actual hours.
- Productivity losses come mostly from waiting, congestion, rework, changes, weather and fatigue, which supervisors can reduce.
- Sustained overtime yields diminishing returns and raises fatigue and injury risk; published curves differ but agree on the direction.
- Visual plans and daily reports connect the plan to reality and support future planning and claims.
- Make-ready
- Removing constraints so that planned work can start as planned.
- Readiness checklist
- A list of prerequisites to confirm before work proceeds.
- Crew balance
- A crew composition in which each person’s time is fully used.
- Unit rate
- Budgeted labour hours (or cost) per unit of installed work.
- Earned hours
- Installed quantity multiplied by the budgeted unit rate.
- Productivity factor
- Earned hours divided by actual hours; above 1.0 is better than budget.
- Trade stacking
- Several trades working in the same area at the same time.
- Scheduled overtime
- Planned work beyond normal hours, often sustained over weeks.
Practice problems
Work each problem on paper first, then reveal the answer to check.
List the planning levels from most general to most detailed.
Show answer
Master schedule, phase plan, look-ahead, weekly work plan, daily plan.
Name six items on a readiness checklist.
Show answer
Information, materials, equipment, labour, prerequisite work, space, permits and inspections, safe conditions, weather.
A crew of 8 at 0.40 worker-hours per m² must form 960 m². How many 8-hour days does it need?
Show answer
960 × 0.40 = 384 worker-hours; 384 / 64 = 6 days.
A crew installs 140 m² at a budgeted 0.40 worker-hours/m² while charging 64 hours. What is its PF?
Show answer
Earned 56 h; PF = 56 / 64 = 0.875.
Why did productivity drop on Thursday in the worked example?
Show answer
An extra worker new to the crew needed direction while the crew was working around delayed material.
Give three factors that reduce productivity and a supervisor response to each.
Show answer
Waiting: make work ready. Trade stacking: sequence by area. Rework: clear instructions and inspections.
In the illustrative overtime example, how much more output did 50 % more hours produce over eight weeks?
Show answer
About 24 %, with labour cost up 75 %.
Why should overtime be treated as a safety decision as well as a cost decision?
Show answer
Long hours increase fatigue, errors and injury risk.
Lesson quiz · 5 questions
Score 60% or more to complete this lesson.
Create a free account to save your progress, take quizzes and earn a certificate.