
CRE-440 · Lesson 3 of 12 · 28 min
Understanding platform analytics data
Every creator decision that uses data depends on understanding where the numbers come from. Platform analytics dashboards look precise, with figures to the last view and charts updated in near real time, but every number rests on definitions, counting rules, estimates and delays chosen by the platform. Those definitions change, sometimes overnight. A creator who does not understand them can mistake a definition change for a real change in audience behaviour, or compare numbers across platforms that are not measuring the same thing. This lesson looks at what the major platforms report, how their key metrics are defined, and the quirks that matter when you use the data for strategy and experiments. CRE-202 introduced the dashboards; here the focus is on reading the data critically.
Platform features and definitions change often. The descriptions below reflect public platform documentation and industry reporting at the time of writing (October 2026); check each platform's current help pages before relying on a specific definition.
Counts, rates and estimates
Analytics numbers fall into three broad types, and each needs different care.
- Counts: the number of times something happened, such as views, likes or new subscribers. Counts depend entirely on counting rules: what qualifies as a view, how duplicates and spam are filtered, and when the count is final.
- Rates and ratios: one count divided by another, such as click-through rate (clicks divided by impressions) or average percentage viewed. Rates depend on both the numerator and the denominator, so a change in how either is counted changes the rate.
- Estimates and modelled figures: numbers the platform calculates rather than counts directly, such as estimated revenue, real-time views, audience demographics based on signed-in users, or reach figures adjusted for sampling. Estimates are useful but carry uncertainty that dashboards rarely show.
What counts as a view
The word view sounds simple, but each platform defines it differently, and definitions change. On YouTube, a long-form view has long required a viewer to start playback intentionally and meet internal quality checks designed to filter automated or low-quality traffic; YouTube does not publish an exact minimum watch time. For Shorts, YouTube changed its public view count on 31 March 2025 so that a view is counted each time a Short starts to play or replays, with no minimum watch time. The older measure, which counted only viewers who kept watching past the first moments, was renamed engaged views and kept in YouTube Analytics. Industry reporting at the time indicated that monetization and Partner Program calculations continued to use engaged views rather than the new total.
Meta made views the primary metric across Instagram and Facebook content in 2025, replacing separate impression and play metrics in its tools and APIs for posts and Reels; reporting by analytics vendors put the API switch at 21 April 2025. TikTok's analytics report video views alongside total play time, average watch time, the share of viewers who watched the full video, and traffic sources. Because these definitions differ, a view on one platform is not equivalent to a view on another.
| Platform and format | Headline count | Stricter engagement measure to watch |
|---|---|---|
| YouTube long-form | Views (filtered, undisclosed threshold) | Average view duration and returning viewers |
| YouTube Shorts | Views counted at start or replay (since 31 March 2025) | Engaged views and viewed versus swiped away |
| Instagram posts and Reels | Views (primary metric since 2025) | Average watch time, saves and shares |
| TikTok | Video views | Average watch time and watched full video share |
For strategy, the practical rule is to rely on stricter engagement measures, such as watch time, returning viewers and engaged views, rather than headline view counts, especially when comparing across platforms or across a definition change.
Worked problem
Adjusting for a definition change
A creator's Shorts averaged 20,000 views per Short in March 2025 and 31,000 in April 2025. Engaged views in Advanced Mode averaged 14,000 in March and 14,700 in April. Did the audience really grow by 55 %?
Show solution
- Headline growth: 31,000 ÷ 20,000 − 1 = 0.55, or 55 %.
- Engaged view growth: 14,700 ÷ 14,000 − 1 = 0.05, or 5 %.
- Most of the headline jump coincides with the counting change on 31 March, which began counting starts and replays.
Answer: Real growth is closer to 5 %. The 55 % headline increase mainly reflects the new counting rule, not new interest.
Delays, revisions and real-time numbers
Analytics data is not final when you first see it. Real-time views are estimates that are later reconciled; detailed reports usually lag by a day or two; revenue figures are estimates until the monthly finalization; and platforms periodically remove views they identify as invalid, which can lower counts after the fact. When you compare a video's first 48 hours with earlier videos, make sure you compare the same window measured the same way, and avoid making decisions on numbers that are still settling.
Impressions and click-through rate
An impression is counted when a thumbnail or post is shown to a viewer, but platforms count impressions in specific places and under specific rules. YouTube's impressions click-through rate, for example, counts impressions in places such as the home page, suggested videos and search results when the thumbnail is shown for a minimum time, and excludes some surfaces such as external sites. Two consequences follow. First, click-through rate varies widely by traffic source, so a falling overall rate can simply mean more of your impressions now come from a source with naturally lower rates, such as browse features. Second, as a video is shown to wider audiences that know you less, its click-through rate usually falls, even if the video is doing well.
Worked problem
Why an average click-through rate can fall when every source improves
Week 1: search provides 10,000 impressions at 8 % click-through and browse provides 40,000 at 4 %. Week 2: search provides 10,000 at 8.5 % and browse provides 140,000 at 4.2 %. What happens to the overall click-through rate?
Show solution
- Week 1 clicks: 10,000 × 0.08 + 40,000 × 0.04 = 800 + 1,600 = 2,400 on 50,000 impressions, or 4.8 %.
- Week 2 clicks: 10,000 × 0.085 + 140,000 × 0.042 = 850 + 5,880 = 6,730 on 150,000 impressions, or about 4.49 %.
- Both sources improved, but browse, with its lower rate, became a much bigger share of impressions.
Answer: Overall click-through fell from 4.8 % to about 4.5 % even though each source improved. This is a mix effect, an example of Simpson's paradox, covered further in lesson 7.
Retention curves
Audience retention charts show the share of viewers still watching at each moment of a video. They are among the most useful charts for creators because they show exactly where viewers lose interest. A typical retention curve drops quickly in the first 30 seconds, as viewers who clicked casually leave, then declines more slowly. Bumps show moments viewers rewatch or skip to; steep cliffs show moments that lose people.
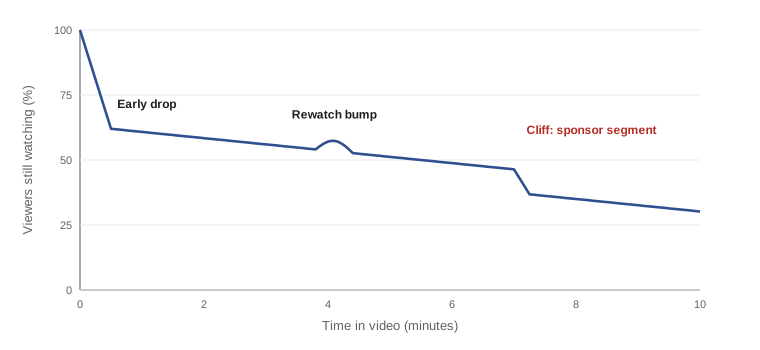
Two retention measures are worth separating. Absolute retention is the share of all viewers still watching at each point. Relative retention, which YouTube shows in some views, compares your video with other videos of similar length. A creator testing a new intro should look at the absolute retention at 30 seconds; one comparing performance against the platform norm may look at relative retention.
Worked problem
Average view duration from a retention curve
A 10-minute video has a simplified retention profile: 100 % of viewers for the first 30 seconds on average, then 60 % for minutes 0.5 to 5, then 40 % for minutes 5 to 10. Approximate the average view duration and average percentage viewed.
Show solution
- First half minute: 0.5 minutes × 1.00 = 0.5 minutes (treating the drop within it as averaging to full attention, a simplification).
- Minutes 0.5 to 5: 4.5 minutes × 0.60 = 2.7 minutes.
- Minutes 5 to 10: 5 minutes × 0.40 = 2.0 minutes.
- Total: 0.5 + 2.7 + 2.0 = 5.2 minutes.
- Average percentage viewed: 5.2 ÷ 10 = 52 %.
Answer: Average view duration is about 5.2 minutes, or 52 % of the video. Average view duration equals the area under the retention curve, which is why a cliff anywhere in the video lowers it.
Returning and new viewers, and cohorts
Most platforms now separate new viewers from returning viewers, and YouTube distinguishes casual from regular viewers. These measures are central to strategy because returning viewers are the core of community and trust. A cohort is a group of viewers who share a starting point, such as everyone who first subscribed in a given month. Following cohorts over time shows whether new audiences stick around.
| Cohort (first month) | Month 1 active | Month 2 | Month 3 | Month 6 |
|---|---|---|---|---|
| January | 100 % | 42 % | 31 % | 22 % |
| February | 100 % | 45 % | 34 % | 24 % |
| March (new series launched) | 100 % | 53 % | 43 % | — |
Cohort tables make it possible to see whether a change worked even when overall numbers are noisy. If the March cohort, which arrived after a new series launched, retains better in months 2 and 3 than earlier cohorts, the series may be building loyalty. Most platforms do not offer full cohort tables, so creators often build simple versions from email or membership data, where each person can be tracked.
Demographics, sampling and privacy limits
Demographic breakdowns such as age, gender and location are typically based on signed-in users who have shared that information, and platforms suppress small groups to protect privacy. Treat demographic data as approximate, especially for small channels or narrow segments. Platforms also do not show creators individual viewer identities, and privacy rules limit what can be shared; lesson 8 discusses collecting your own audience data responsibly.
Exporting and keeping your own records
Dashboards change, definitions change and old data can be hard to retrieve. A simple habit protects your ability to learn from the past: export key metrics monthly into a spreadsheet, note any definition changes and major events beside the data, and keep a log of what you published and changed. This record becomes the raw material for the experiments and analysis in the rest of the course. It also lets you compare platforms using your own consistent definitions, such as engaged views or watch time, instead of each platform's headline count.
Common mistakes
MistakeComparing headline view counts across platforms as if they measure the same thing.
InsteadUse stricter engagement measures, such as watch time or engaged views, and note each platform's definition.
MistakeTreating a definition change as audience growth.
InsteadLog platform changes and check stricter metrics that kept the old definition.
MistakeMaking decisions on real-time numbers.
InsteadWait until data settles and compare equal time windows.
MistakePanicking when overall click-through rate falls.
InsteadBreak it down by traffic source; a mix shift can lower the average while every source improves.
MistakeRelying only on platform dashboards for history.
InsteadExport key metrics monthly and annotate definition changes and events.
Summary and key terms
- Analytics numbers are counts, rates or estimates, and each depends on platform definitions.
- A view is defined differently on each platform; YouTube changed Shorts view counting on 31 March 2025 and kept engaged views.
- Meta made views the primary metric across Instagram and Facebook in 2025, replacing impressions and plays.
- Data is delayed and revised; compare equal windows and avoid deciding on real-time figures.
- Click-through rate depends on traffic source mix, so averages can mislead.
- Average view duration is the area under the retention curve; cliffs show where viewers leave.
- Cohorts and returning-viewer measures show whether audiences stick, and personal exports protect your history.
- Count
- The number of times an event occurred, under a platform's counting rules.
- Rate
- One count divided by another, such as clicks per impression.
- Estimate
- A figure calculated or modelled by a platform rather than counted directly.
- Engaged views
- YouTube's measure of Shorts viewers who continue watching, kept after the 2025 counting change.
- Impression
- A count of times a thumbnail or post was shown to a viewer under platform rules.
- Click-through rate
- Clicks divided by impressions, usually shown as a percentage.
- Retention curve
- A chart of the share of viewers still watching at each point in a video.
- Average view duration
- The average time viewers spend watching a video; the area under the retention curve.
- Cohort
- A group of viewers who share a starting point, tracked over time.
- Mix effect
- A change in an average caused by a shift in the proportions of subgroups rather than within them.
Practice problems
Work each problem on paper first, then reveal the answer to check.
Name the three broad types of analytics numbers.
Show answer
Counts, rates and estimates.
What changed for YouTube Shorts on 31 March 2025?
Show answer
Views began counting each start or replay with no minimum watch time; the old measure became engaged views.
Shorts views rose from 10,000 to 16,000 but engaged views rose from 7,000 to 7,350. What is real growth?
Show answer
About 5 %, based on engaged views.
Why should you avoid deciding on real-time views?
Show answer
They are estimates that are later revised and still settling.
Search: 5,000 impressions at 10 %. Browse: 45,000 at 3 %. What is overall click-through?
Show answer
(500 + 1,350) ÷ 50,000 = 3.7 %.
What does a steep cliff on a retention curve show?
Show answer
A moment where many viewers stop watching.
A 12-minute video has 40 % average percentage viewed. What is the average view duration?
Show answer
4.8 minutes.
What is a cohort?
Show answer
A group of viewers sharing a starting point, such as first subscribing in the same month.
Why treat demographic data as approximate?
Show answer
It is based on signed-in users who share data, and small groups are suppressed.
Give one benefit of monthly exports.
Show answer
They preserve history and let you note definition changes.
Lesson quiz · 5 questions
Score 60% or more to complete this lesson.
Create a free account to save your progress, take quizzes and earn a certificate.