
ECON-101 · Lesson 3 of 12 · 28 min
Supply and demand
Supply and demand is the most widely used model in economics. It explains why the price of gasoline jumps before a long weekend, why concert tickets resell for many times their face value, why the price of eggs rose sharply after outbreaks of avian influenza, and why the rents in a booming city climb. The model describes a competitive market, one with many buyers and many sellers, none of whom can individually influence the price. Few real markets fit this description exactly, but many come close enough that the model predicts well, and even where it does not, it provides the benchmark against which other market structures are compared in lessons 9 to 11.
Demand
The quantity demanded of a good is the amount buyers are willing and able to purchase at a given price during a given period. Demand is not simply what people want; it is what they want and can afford. The law of demand states that, other things being equal, when the price of a good rises, the quantity demanded falls, and when the price falls, the quantity demanded rises. There are two main reasons. The substitution effect: when coffee becomes more expensive relative to tea, some people switch to tea. The income effect: a higher price reduces the purchasing power of a given income, so people buy less of most goods. Lesson 7 examines these effects more closely.
A demand schedule is a table showing the quantity demanded at each price, and a demand curve is a graph of that schedule, sloping downward from left to right. Market demand is the sum of the quantities demanded by all buyers at each price; graphically, we add individual demand curves horizontally.
| Price per kg of coffee beans | Quantity demanded (thousand kg per week) | Quantity supplied (thousand kg per week) |
|---|---|---|
| $10 | 90 | 30 |
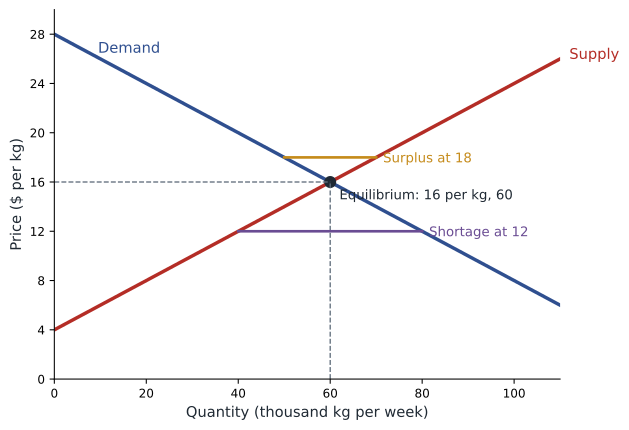
| $12 | 80 | 40 |
| $14 | 70 | 50 |
| $16 | 60 | 60 |
| $18 | 50 | 70 |
| $20 | 40 | 80 |
What shifts demand
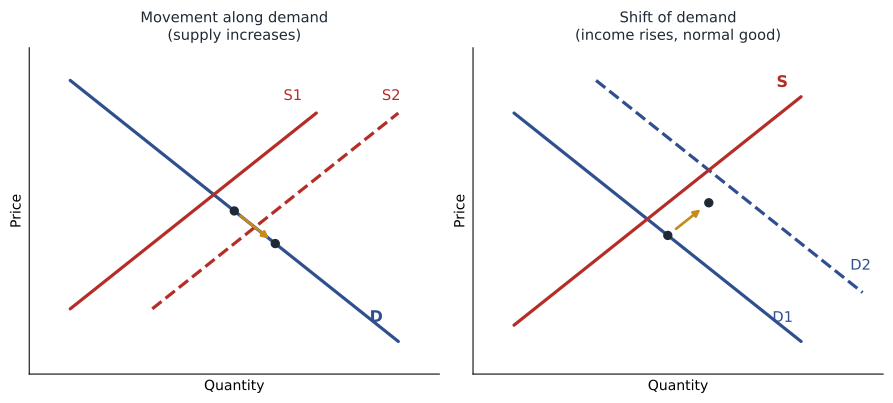
A change in the price of the good itself causes a movement along the demand curve, called a change in quantity demanded. A change in any other factor that affects buyers shifts the whole curve, called a change in demand. The main demand shifters are these. Income: for a normal good, such as restaurant meals, higher income increases demand; for an inferior good, such as instant noodles or long-distance bus travel, higher income reduces demand as people switch to better alternatives. Prices of related goods: a rise in the price of a substitute (tea for coffee) increases demand for the good, and a rise in the price of a complement (cream or coffee makers) reduces it. Tastes and preferences, shaped by fashion, health information and advertising. Expectations: if buyers expect prices to rise, they buy more now. Number of buyers: population growth, immigration and the opening of new markets increase demand. Government policies, such as subsidies for electric vehicles, also shift demand.
Supply
The quantity supplied is the amount sellers are willing and able to sell at a given price. The law of supply states that, other things being equal, a higher price raises the quantity supplied. A higher price makes production more profitable, encourages existing producers to expand output, perhaps by running overtime or using less efficient equipment, and attracts new producers. The supply curve slopes upward. Market supply is the horizontal sum of all sellers' supply curves.
The supply shifters are these. Input prices: higher wages, energy or raw material costs reduce supply, shifting the curve left. Technology: better production methods reduce costs and increase supply. Prices of related goods in production: if the price of canola rises, Prairie farmers may plant more canola and less wheat, reducing the supply of wheat. Expectations: if producers expect higher prices later, they may hold back supply now. Number of sellers. Government policies: taxes reduce supply and subsidies increase it. And for agricultural goods especially, nature: droughts, floods, frosts and disease can sharply reduce supply.
Market equilibrium
The equilibrium price is the price at which the quantity demanded equals the quantity supplied; at that price the market clears, with no surplus or shortage. In the coffee example, equilibrium is at $16 per kilogram, where 60 thousand kilograms are bought and sold each week. If the price were above equilibrium, say $18, sellers would want to sell 70 thousand kg but buyers would take only 50 thousand, leaving a surplus of 20 thousand kg. Unsold stock would pile up, and sellers would cut prices to clear it. If the price were below equilibrium, say $12, buyers would want 80 thousand kg but sellers would offer only 40 thousand, a shortage of 40 thousand kg. Buyers would compete for the scarce coffee, and sellers would raise prices. Either way, the price moves toward equilibrium. This tendency is what economists mean when they say markets 'clear'.
With straight-line demand and supply curves, equilibrium can be found algebraically. Write demand as \( Q_d = a - bP \) and supply as \( Q_s = c + dP \). Setting them equal gives the equilibrium price and quantity.
Worked problem
Solving for equilibrium
The demand for coffee beans is \( Q_d = 140 - 5P \) and supply is \( Q_s = -20 + 5P \), with Q in thousand kg and P in dollars per kg. Find the equilibrium price and quantity, and the shortage at a price of $12.
Show solution
- Set \( 140 - 5P = -20 + 5P \).
- Then \( 160 = 10P \), so \( P^* = 16 \).
- Quantity: \( Q^* = 140 - 5(16) = 60 \) thousand kg.
- At $12: \( Q_d = 140 - 60 = 80 \) and \( Q_s = -20 + 60 = 40 \), a shortage of 40 thousand kg.
Answer: Equilibrium is $16 and 60 thousand kg per week, matching the schedule. At $12 there is a shortage of 40 thousand kg.
# Equilibrium with linear demand and supply, before and after a demand shift
def equilibrium(a, b, c, d):
    p = (a - c) / (b + d)
    return p, a - b * p
a, b = 140, 5    # demand: Qd = a - b*P
c, d = -20, 5    # supply: Qs = c + d*P
p0, q0 = equilibrium(a, b, c, d)
print(f"initial equilibrium: P = ${p0:.2f}, Q = {q0:.1f} thousand kg")
# A health study praising coffee raises demand by 20 thousand kg at every price
p1, q1 = equilibrium(a + 20, b, c, d)
print(f"after demand increase: P = ${p1:.2f}, Q = {q1:.1f} thousand kg")
# A frost in growing regions raises costs: supply falls by 15 thousand kg at every price
p2, q2 = equilibrium(a + 20, b, c - 15, d)
print(f"after demand increase and supply decrease: P = ${p2:.2f}, Q = {q2:.1f} thousand kg")initial equilibrium: P = $16.00, Q = 60.0 thousand kg after demand increase: P = $18.00, Q = 70.0 thousand kg after demand increase and supply decrease: P = $19.50, Q = 62.5 thousand kg
The output shows the standard predictions. An increase in demand raises both the equilibrium price and quantity: here the price rises by $2 to $18 and the quantity by 10 thousand kg. When supply then falls as well, the price rises further, to $19.50, while the quantity falls back to 62.5 thousand kg. When both curves shift, the direction of one variable is certain and the other depends on the relative sizes of the shifts.
Four basic cases
Every change in a competitive market can be analysed in three steps: decide whether the event shifts demand, supply or both; decide the direction of each shift; and use the diagram to see how the equilibrium price and quantity change. The four basic cases are summarized below.
| Event | Example | Price | Quantity |
|---|---|---|---|
| Demand increases | A heat wave raises demand for air conditioners | Rises | Rises |
| Demand decreases | A recession reduces demand for new cars | Falls | Falls |
| Supply increases | A bumper harvest of canola | Falls | Rises |
| Supply decreases | Avian influenza culls laying hens | Rises | Falls |
| Demand and supply both increase | Population growth and new technology in phones | Uncertain | Rises |
| Demand increases, supply decreases | Strong demand for housing with rising construction costs | Rises | Uncertain |
A common error is to reason that a rise in price reduces demand, which reduces price, and so on in circles. The way to avoid this is to keep the distinction between shifts and movements clear. If a frost destroys part of the coffee harvest, supply shifts left; the price rises; and buyers respond by moving up along an unchanged demand curve to a lower quantity demanded. Demand itself has not changed.
Applications
Housing markets illustrate the model well. In many Canadian and US cities over the past two decades, demand for housing grew quickly because of population growth, immigration, rising incomes and, until 2022, low interest rates, while supply grew slowly because of zoning restrictions, approval delays, land shortages and rising construction costs. The predictable result was rising prices and rents. When interest rates rose sharply in 2022 and 2023, demand from buyers financing with mortgages fell, and prices in many markets declined. Policy debates about housing affordability are, in large part, debates about which shifts to encourage: demand-side measures such as buyer subsidies tend to raise prices further when supply is inelastic, while supply-side measures such as relaxing zoning aim to shift supply outward.
Egg prices offer a more recent example. Outbreaks of highly pathogenic avian influenza in 2022 to 2025 led to the culling of tens of millions of laying hens in the United States, sharply reducing supply. With demand for eggs fairly insensitive to price in the short run, retail prices more than doubled at the peak in early 2025 before falling as flocks were rebuilt. Canada's supply-managed egg sector was also affected by outbreaks, but its quota and pricing system smoothed retail price swings, illustrating how institutions shape market outcomes.
Worked problem
Analysing a market event
A new study reports that a popular sweetener causes health problems, and at the same time a new factory doubles the capacity to produce it. Predict the effect on price and quantity.
Show solution
- The study reduces demand: demand shifts left.
- The new factory increases supply: supply shifts right.
- Both shifts lower the price, so the price falls.
- The demand shift lowers quantity and the supply shift raises it, so the change in quantity is uncertain.
Answer: The price falls; the quantity may rise or fall depending on which shift is larger.
Prices as signals
Friedrich Hayek emphasized in 1945 that prices transmit information that no central planner could gather. When a frost hits Brazil's coffee regions, roasters, cafés and consumers around the world need not know why coffee has become scarcer; the rising price tells them to economize, and tells growers elsewhere to expand. Prices thus perform three functions: they signal changes in scarcity, they provide incentives to respond, and they ration goods among competing buyers. This is why economists tend to be wary of policies that stop prices from adjusting, the subject of lesson 6.
The supply and demand model has limits. It assumes competitive markets, so it does not describe a market dominated by one or a few sellers (lessons 10 and 11). It assumes buyers and sellers have good information, which may not hold for used cars or health insurance. And it assumes that all costs and benefits fall on the buyers and sellers, which is not true when there are external effects such as pollution (lesson 12). Recognizing these limits is part of using the model well.
Common mistakes
MistakeHigher prices reduce demand.
InsteadHigher prices reduce quantity demanded, a movement along the curve; demand shifts only when a non-price factor changes.
MistakeIf the price of a good rises and the quantity sold also rises, the law of demand has been violated.
InsteadDemand probably increased (shifted right), raising both price and quantity along an upward-sloping supply curve.
MistakeAn increase in supply means producers charge more.
InsteadAn increase in supply means more is offered at every price, which lowers the equilibrium price.
MistakeWhen both demand and supply increase, the price must rise.
InsteadQuantity rises, but the price change depends on the relative size of the two shifts.
MistakeA shortage means the good is physically unavailable.
InsteadA shortage means quantity demanded exceeds quantity supplied at the current price, usually because the price is below equilibrium.
Summary and key terms
- The law of demand: other things equal, a higher price lowers quantity demanded, through substitution and income effects.
- Demand shifts with income, prices of substitutes and complements, tastes, expectations, number of buyers and policy.
- The law of supply: other things equal, a higher price raises quantity supplied.
- Supply shifts with input prices, technology, related goods in production, expectations, number of sellers, policy and nature.
- Equilibrium is where quantity demanded equals quantity supplied; surpluses and shortages push the price toward it.
- With linear curves, equilibrium price is \( (a - c)/(b + d) \).
- Analyse events by deciding which curve shifts, in which direction, and reading the new equilibrium.
- Prices signal scarcity, create incentives and ration goods.
- Quantity demanded
- The amount buyers are willing and able to buy at a given price.
- Law of demand
- Other things equal, quantity demanded falls when price rises.
- Normal good
- A good whose demand rises when income rises.
- Inferior good
- A good whose demand falls when income rises.
- Substitutes
- Goods used in place of each other; a higher price of one raises demand for the other.
- Complements
- Goods used together; a higher price of one lowers demand for the other.
- Law of supply
- Other things equal, quantity supplied rises when price rises.
- Equilibrium price
- The price at which quantity demanded equals quantity supplied.
- Surplus
- Quantity supplied exceeds quantity demanded at the current price.
- Shortage
- Quantity demanded exceeds quantity supplied at the current price.
Practice problems
Work each problem on paper first, then reveal the answer to check.
Distinguish a change in demand from a change in quantity demanded.
Show answer
A change in demand shifts the curve; a change in quantity demanded is a movement along it caused by the good's own price.
Incomes rise. What happens to demand for instant noodles?
Show answer
It falls if noodles are an inferior good.
The price of printers falls. What happens to demand for ink?
Show answer
It rises, because ink is a complement.
Demand is \( Q_d = 200 - 4P \) and supply \( Q_s = 20 + 2P \). Find equilibrium.
Show answer
P = 30, Q = 80.
At P = 25 in the previous question, is there a surplus or shortage, and how large?
Show answer
Shortage: Qd = 100, Qs = 70, shortage of 30.
A drought hits wheat farms. Predict the effect on bread prices.
Show answer
Supply of wheat falls, raising wheat and bread prices.
Demand for electric cars rises and battery costs fall. Effect on price and quantity?
Show answer
Quantity rises; price uncertain.
Why might demand-side housing subsidies raise prices?
Show answer
They shift demand right; with inelastic supply, much of the subsidy shows up as higher prices.
Name three functions of prices.
Show answer
Signalling, incentives and rationing.
Portfolio task: pick a product whose price changed sharply this year and explain the change with a supply and demand diagram.
Show answer
Answers vary; should identify the shift and its direction.
Lesson quiz · 5 questions
Score 60% or more to complete this lesson.
Create a free account to save your progress, take quizzes and earn a certificate.