
MATH-100 · Lesson 12 of 12 · 28 min
Calculus in engineering: modelling and a project
The previous eleven lessons built the tools of single-variable calculus: limits, derivatives and their rules, the shape of graphs, optimization, antiderivatives and differential equations, definite integrals, accumulation, approximation and error. Engineers rarely meet these tools one at a time. A real problem arrives as a question about a physical system, and the engineer must decide which quantities matter, write equations that describe them, choose the right mathematical tools, solve, check and explain the result. This process is called mathematical modelling. This final lesson describes the modelling cycle, works through three case studies that combine several lessons each, offers advice on presenting quantitative results, and sets a course project in which you build and analyse a model of your own.
The modelling cycle
Mathematical modelling follows a cycle that experienced engineers apply almost without thinking:
- Understand the question. What decision does the answer support? What accuracy is needed?
- Identify the variables and parameters, with their units: what changes, what is fixed, and what is unknown.
- State the assumptions. Every model simplifies reality: a tank is a cylinder, drag is proportional to speed, heat loss is steady. Writing the assumptions down makes them easy to question later.
- Formulate the equations, usually from conservation laws (mass, energy, momentum, charge), rate laws and geometry.
- Solve, analytically where possible and numerically where not.
- Check: units, limiting cases (what happens if a parameter is zero or very large?), orders of magnitude, and comparison with data or experience.
- Interpret and communicate the result in terms of the original question, including its uncertainty.
- Refine: if the result is not accurate enough, relax the assumption that matters most and repeat.
The British statistician George Box summarized the attitude this cycle requires: all models are wrong, but some are useful. A model is useful when its simplifications do not affect the decision it supports.
Case study 1: sizing a stormwater storage tank
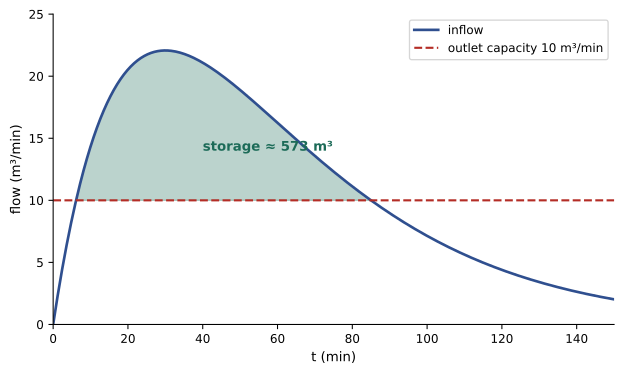
Urban development replaces fields with roofs and pavement, so rain runs off faster and in larger peaks. Municipalities therefore require new developments to store runoff temporarily and release it slowly. Suppose a site's storm inflow to an underground tank is modelled as \(Q_{in}(t) = 2t\,e^{-t/30}\) m³/min, with \(t\) in minutes from the start of the storm, and the outlet releases at most 10 m³/min. How large must the tank be?
- Accumulation (Lessons 9 and 10): storage builds up while inflow exceeds outflow, and is greatest when inflow falls back below outflow. The required volume is the area between the inflow curve and the outflow line, between the times where they cross.
- Finding the crossing times means solving \(2t\,e^{-t/30} = 10\), which has no algebraic solution. Newton's method (Lesson 7) from starting guesses of 6 and 85 minutes gives \(t_1 = 6.13\) min and \(t_2 = 85.0\) min.
- The required antiderivative is not in our table, but it can be found by guessing a form and checking by differentiation: \(\dfrac{d}{dt}\big[-30(t + 30)e^{-t/30}\big] = t\,e^{-t/30}\), which you can verify with the product rule (Lesson 4). MATH-101 shows how to find it systematically by integration by parts.
Worked problem
Required storage volume
Compute the storage volume \(\int_{t_1}^{t_2}\left(2t\,e^{-t/30} - 10\right)dt\) with \(t_1 = 6.13\) and \(t_2 = 85.0\).
Show solution
- Antiderivative: \(F(t) = -60(t + 30)e^{-t/30} - 10t\).
- \(F(85.0) = -60 \times 115.0 \times e^{-2.833} - 850 = -60 \times 115.0 \times 0.0588 - 850 = -405.8 - 850 = -1255.8\).
- \(F(6.13) = -60 \times 36.13 \times e^{-0.204} - 61.3 = -60 \times 36.13 \times 0.815 - 61.3 = -1767.1 - 61.3 = -1828.4\).
- Volume: \(F(85.0) - F(6.13) = 572.6\) m³.
Answer: About 573 m³ of storage, which a designer would round up and add freeboard to. The peak inflow of 22 m³/min occurs at 30 minutes, but the tank is fullest at 85 minutes, when inflow drops back to the outlet rate. A sensitivity check with a larger storm or a smaller outlet shows how quickly the required volume grows, which is why design storms and outlet sizes are specified carefully in municipal standards.
Case study 2: a falling package with drag
A sensor package is dropped from a drone with a small parachute. Air resistance on the parachute is modelled, as a first approximation, as proportional to speed. How fast does the package fall, how quickly does it reach that speed, and how far does it fall in 10 seconds?
- Newton's second law with gravity and linear drag gives \(\dfrac{dv}{dt} = g - kv\), where \(k\) depends on the parachute and the mass. Measured drop tests give \(k = 1.5\) s⁻¹.
- This is the approach-to-equilibrium equation of Lesson 8, with equilibrium (terminal) velocity \(v_t = g/k\) and time constant \(1/k\).
- Position is the integral of velocity (Lesson 9).
Worked problem
Terminal velocity and fall distance
With \(g = 9.81\) m/s² and \(k = 1.5\) s⁻¹, starting from rest, find the terminal velocity, the velocity after 2 s, and the distance fallen in 10 s.
Show solution
- Terminal velocity: \(v_t = 9.81/1.5 = 6.54\) m/s.
- Solution: \(v(t) = 6.54(1 - e^{-1.5t})\). At 2 s: \(6.54(1 - e^{-3}) = 6.21\) m/s, 95 percent of terminal velocity.
- Distance: \(s(10) = \int_0^{10} 6.54(1 - e^{-1.5t})\,dt = 6.54\left[t + \tfrac{1}{1.5}e^{-1.5t}\right]_0^{10} = 6.54(10 - 0.667) = 61.0\) m.
Answer: The package approaches 6.5 m/s within about 2 seconds and falls about 61 m in 10 s. Checking limits: without drag (k → 0), the model must reduce to free fall, s = ½gt², which it does when the exponential is expanded with Taylor polynomials (Lesson 11). For faster objects, drag grows with the square of speed, and the model must be refined, leading to equations treated in MATH-201.
Case study 3: the economic thickness of insulation
Thicker insulation on a heated building costs more to install but saves heating energy every year. The most economical thickness balances the two. For one square metre of wall, suppose the annualized cost of insulation is $0.80 per centimetre of thickness \(x\), and the annual cost of heat lost through the wall is \(\dfrac{63.4}{2 + x}\) dollars, a model derived from the wall's thermal resistance, the local heating degree-days and the price of energy. The total annual cost is:
Worked problem
Optimal thickness
Find the thickness that minimizes total annual cost, and the minimum cost.
Show solution
- Derivative: \(C'(x) = 0.80 - \dfrac{63.4}{(2 + x)^2}\). Setting it to zero: \((2 + x)^2 = 79.25\), so \(x = 6.90\) cm.
- Second derivative: \(C''(x) = \dfrac{126.8}{(2 + x)^3} > 0\), so this is a minimum (Lesson 6).
- Cost: \(C(6.90) = 5.52 + 7.12 = 12.64\) dollars per square metre per year.
Answer: About 7 cm of insulation, at $12.64 per square metre per year. At the optimum, the marginal cost of one more centimetre of insulation equals the marginal saving in heating cost (Lesson 5). Because the cost curve is flat near its minimum, 6 or 8 cm would cost only a few cents more, so practical choices such as standard product thicknesses and building code minimums usually decide the final value. If energy prices double, the optimum rises to about 10.6 cm, a sensitivity worth reporting.
Presenting quantitative results
A correct calculation is only useful if others can understand and trust it. Good practice includes:
- State the question, the assumptions and the data sources before the results.
- Carry units through every calculation, and check that the units of the answer are right.
- Report a sensible number of significant figures, consistent with the accuracy of the input data: a storage volume computed from a rainfall estimate good to 20 percent should not be reported as 572.64 m³.
- Show the key steps, so that a reviewer can follow and check them, and give limiting-case checks.
- Include a sensitivity analysis: how does the answer change if the most uncertain inputs change? Lesson 5's logarithmic method and Lesson 3's linear approximation make quick sensitivity estimates easy.
- Use graphs to show behaviour, with labelled axes and units.
Professional engineers sign and seal designs that depend on such calculations, and engineering regulators in Canada and the United States hold them responsible for their accuracy. Clear, checkable calculations protect the public and the engineer.
The course project
Choose one of the following problems, or propose your own of similar scope with your instructor's approval, and write a short technical report.
- Project A: Stormwater storage. For a site of your choice, model a storm inflow with a function of the form \(Q(t) = a\,t\,e^{-t/b}\), choose parameters that match a stated peak flow and time to peak, and find the storage required for two outlet capacities. Use Newton's method for the crossing times and check the volume with the trapezoid rule.
- Project B: Cooling or heating. Collect temperature measurements of a cooling object (a mug of hot water, a laptop power adapter after unplugging) at regular intervals. Fit Newton's law of cooling using a semi-logarithmic plot, estimate the time constant, compare the model's predictions with later measurements, and estimate derivatives from your data with central differences.
- Project C: Optimization. Model a design trade-off with a cost or performance function of one variable (insulation thickness, pipe diameter versus pumping energy, the dimensions of a container of fixed volume), find the optimum with calculus, and analyse how it changes with the main parameters.
The report should include:
- A statement of the problem and the decision it supports.
- Variables, parameters with units, and assumptions.
- The model equations, with their origin explained.
- Analytical solutions where possible, and numerical methods (with a convergence check) where not.
- At least one graph, produced by hand or software and checked against your analysis of its shape.
- Checks of units, limiting cases and orders of magnitude.
- A sensitivity analysis of at least two parameters.
- Conclusions and a discussion of the model's limitations and how it could be refined.
Looking ahead
Calculus continues in several directions in the courses that follow. MATH-101 develops techniques of integration, applications such as volumes, work and centroids, and infinite series, including Taylor series. MATH-125 introduces linear algebra, the mathematics of systems of equations and transformations. MATH-209 extends calculus to functions of several variables, and MATH-201 treats differential equations systematically. Physics, circuits, fluid mechanics, heat transfer, structures and control all use these tools from the first week. The habits built in this course, of reasoning about rates and accumulations, checking answers, and approximating with care, are the foundation for all of them.
Common mistakes
MistakeJumping to equations without stating assumptions.
InsteadWrite down variables, units and assumptions first, so they can be checked.
MistakeSizing storage for the peak inflow time.
InsteadStorage is greatest when inflow falls back to the outflow rate.
MistakeReporting results to more digits than the data justify.
InsteadMatch significant figures to the accuracy of the inputs.
MistakeSkipping limiting-case checks.
InsteadCheck that the model behaves sensibly when parameters are zero or very large.
MistakePresenting an optimum without sensitivity.
InsteadShow how the optimum and the cost change with uncertain inputs.
Summary and key terms
- Modelling cycles through question, variables, assumptions, equations, solution, checks, interpretation and refinement.
- Stormwater storage is the area between inflow and outflow curves between their crossing times.
- Linear drag gives an approach to terminal velocity g/k with time constant 1/k.
- Economic optimization balances marginal costs and savings; flat optima leave room for practical choices.
- Good reports carry units, sensible precision, key steps, limiting-case checks and sensitivity analysis.
- The course project applies the full modelling cycle to storage, cooling or optimization.
- Calculus continues in MATH-101, MATH-125, MATH-201 and MATH-209 and in every engineering discipline.
- Mathematical model
- A set of equations representing a real system.
- Assumption
- A simplification made so that a model can be formulated and solved.
- Parameter
- A quantity held fixed in a model but that may vary between cases.
- Conservation law
- A principle that a quantity such as mass or energy is neither created nor destroyed.
- Limiting case
- A check of model behaviour when a parameter is zero or very large.
- Terminal velocity
- The constant speed at which drag balances gravity.
- Detention storage
- Temporary storage that releases stormwater slowly.
- Economic thickness
- The insulation thickness minimizing total annual cost.
- Sensitivity analysis
- Study of how outputs change with inputs.
- Significant figures
- The digits in a number that carry meaningful precision.
Practice problems
Work each problem on paper first, then reveal the answer to check.
List the steps of the modelling cycle.
Show answer
Question, variables, assumptions, equations, solve, check, interpret, refine.
Verify that \(\frac{d}{dt}[-30(t + 30)e^{-t/30}] = te^{-t/30}\).
Show answer
−30e^(−t/30) + (t + 30)e^(−t/30) = te^(−t/30).
If the outlet in case study 1 were 15 m³/min, would storage increase or decrease?
Show answer
Decrease, because less inflow exceeds the outlet rate.
With k = 2 s⁻¹, what is the terminal velocity in the drag model?
Show answer
9.81/2 = 4.9 m/s.
How long does the package take to reach 99% of terminal velocity with k = 1.5?
Show answer
ln 100 / 1.5 ≈ 3.1 s.
Why must the drag model reduce to free fall as k → 0?
Show answer
With no drag, only gravity acts; this is a limiting-case check.
Minimize \(C(x) = 2x + 50/x\) for \(x > 0\).
Show answer
x = 5, C = 20.
In case study 3, what thickness is optimal if insulation costs $1.60 per cm?
Show answer
(2 + x)² = 39.6, x ≈ 4.3 cm.
A volume is computed as 572.64 m³ from data accurate to about 10%. How should it be reported?
Show answer
About 570 m³ (or 5.7 × 10² m³).
Name two checks every model result should pass.
Show answer
Units, limiting cases, order of magnitude, comparison with data.
Lesson quiz · 5 questions
Score 60% or more to complete this lesson.
Create a free account to save your progress, take quizzes and earn a certificate.