
MATH-209 · Lesson 1 of 5 · 39 min
Functions of several variables
In first-year calculus, functions had one input: the deflection of a beam at position \(x\), the velocity at time \(t\). Real engineering quantities usually depend on several inputs at once. The temperature in a steel plate depends on two coordinates; the pressure of a gas depends on its volume and temperature; the stress in a dam depends on three coordinates; the wind chill you feel depends on air temperature and wind speed. Multivariable calculus extends derivatives and integrals to such functions, and it is the mathematical language of fluid mechanics, heat transfer, electromagnetics, solid mechanics and optimization.
This first chapter builds intuition before calculus: how to describe functions of two and three variables, picture them as surfaces and contour maps, read engineering contour plots, and understand what limits and continuity mean when you can approach a point from infinitely many directions.
Functions of two variables
A function of two variables assigns one number \(z = f(x, y)\) to each point \((x, y)\) in a set called the domain. The set of output values is the range. As in single-variable calculus, the domain is either stated or taken as every input for which the formula makes sense.
Worked problem
Finding a domain
Find and describe the domains of (a) \(f(x, y) = \sqrt{9 - x^2 - y^2}\) and (b) \(g(x, y) = \ln(y - x)\).
Show solution
- (a) The square root needs \(9 - x^2 - y^2 \ge 0\), so \(x^2 + y^2 \le 9\): a closed disk of radius 3 centred at the origin.
- (b) The logarithm needs \(y - x > 0\), so \(y > x\): the half-plane above the line \(y = x\), not including the line.
Answer: (a) The disk x² + y² ≤ 9, including its boundary circle; (b) the open half-plane y > x. The range of f is 0 ≤ z ≤ 3: z is largest (3) at the centre and zero on the boundary
Engineering functions often come from formulas fitted to data or derived from physics, and their domains carry physical meaning: absolute temperature must be positive, a length cannot be negative, a fitted formula may only be valid over the range of the tests behind it.
Worked problem
Wind chill
Environment and Climate Change Canada calculates the wind chill index from air temperature \(T\) (°C) and wind speed \(V\) (km/h, at 10 m height) as \(W = 13.12 + 0.6215T - 11.37V^{0.16} + 0.3965TV^{0.16}\). Find W for \(T = -20\) °C and \(V = 30\) km/h.
Show solution
- \(V^{0.16} = 30^{0.16} = 1.7230\).
- \[W = 13.12 + 0.6215(-20) - 11.37(1.7230) + 0.3965(-20)(1.7230)\]
- \[= 13.12 - 12.43 - 19.59 - 13.66 = -32.6\]
Answer: W ≈ −33: the wind makes −20 °C feel like −33 °C on exposed skin. W is a function of two variables, and it has a restricted domain: the formula is intended for temperatures at or below about 10 °C and wind speeds above about 5 km/h
Graphs and surfaces
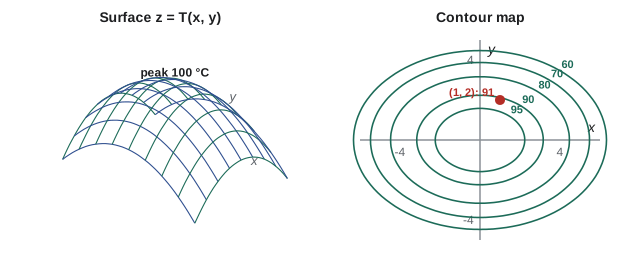
The graph of \(f(x, y)\) is the set of points \((x, y, z)\) with \(z = f(x, y)\): a surface in three dimensions, sitting above (or below) the domain in the xy-plane. You can picture the function as a landscape, with \(z\) as the height of the ground above each map point.
Some surfaces appear constantly and are worth recognizing from their equations:
- A plane: \(z = ax + by + c\).
- A paraboloid (bowl or dome): \(z = x^2 + y^2\) opens upward; \(z = 100 - x^2 - 2y^2\) is an elliptic dome opening downward.
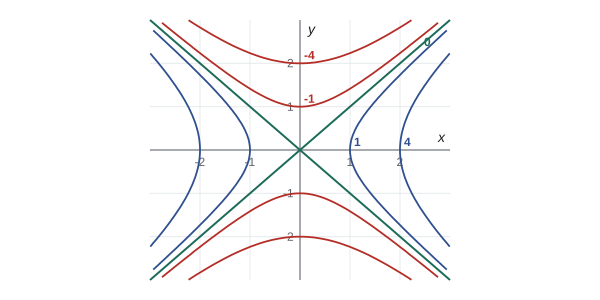
- A saddle (hyperbolic paraboloid): \(z = x^2 - y^2\) curves up along the x-axis and down along the y-axis. Saddle shapes appear in roof structures and in the analysis of critical points in Lesson 2.
- A cone: \(z = \sqrt{x^2 + y^2}\).
- A hemisphere: \(z = \sqrt{r^2 - x^2 - y^2}\), the function in the domain example above.
Level curves and contour maps
Drawing surfaces is hard and reading values off them is harder. Engineers far more often use contour maps. A level curve (or contour) of \(f\) is the set of points where \(f(x, y) = k\) for a constant \(k\). A contour map shows several level curves, usually at equal intervals of \(k\), on the xy-plane.
You use contour maps already: topographic maps show elevation contours, weather maps show isobars (equal pressure) and isotherms (equal temperature). In engineering they show stress in a component, temperature in a heat sink, groundwater head under a dam, and noise levels around an airport.
Worked problem
Isotherms on a plate
The temperature (°C) on a heated plate is \(T(x, y) = 100 - x^2 - 2y^2\), with \(x, y\) in centimetres. Describe the isotherms, find the temperature at (1, 2), and find the isotherm through that point.
Show solution
- Isotherm \(T = k\): \(x^2 + 2y^2 = 100 - k\). For \(k < 100\), these are ellipses centred at the origin with semi-axes \(\sqrt{100 - k}\) along x and \(\sqrt{(100 - k)/2}\) along y, so each is \(\sqrt{2}\) times longer in x than in y.
- \(T(1, 2) = 100 - 1 - 8 = 91\) °C.
- Isotherm through (1, 2): \(x^2 + 2y^2 = 9\), an ellipse with semi-axes 3 cm (along x) and \(3/\sqrt{2} = 2.12\) cm (along y).
Answer: The isotherms are nested ellipses around the hot spot at the origin (100 °C). The point (1, 2) is at 91 °C, on the ellipse x² + 2y² = 9
Contour spacing carries information. Where contours are close together the function changes rapidly; where they are far apart it changes slowly. On a topographic map, tight contours mean a steep slope. In the plate, the isotherms crowd together near the edges, so heat flows fastest there. In Lesson 2, the gradient will make this precise: it points straight across the contours, and its size is inversely related to their spacing.
Worked problem
Reading a slope from a map
On a 1:25 000 topographic map with a 10 m contour interval, two adjacent contours along a proposed access road are 4 mm apart. What is the average grade of the ground there?
Show solution
- Horizontal distance: \(4 \text{ mm} \times 25\,000 = 100\,000\) mm = 100 m.
- Rise: one contour interval, 10 m.
- Grade = 10/100 = 0.10, or 10%.
Answer: A 10% grade, steep for a road; many highway design guides limit sustained grades to well under that. The engineer would look for a route that crosses the contours at an angle, lengthening the path to reduce the grade, which is why mountain roads switch back
Functions of three or more variables
A function \(w = f(x, y, z)\) assigns a number to each point in space: the temperature in a room, the concentration of a pollutant in an aquifer, the electric potential around a charge. Its graph would need four dimensions, so instead we picture level surfaces, where \(f(x, y, z) = k\).
Worked problem
Level surfaces of a potential
The electric potential of a point charge at the origin is \(V = k_e q / r\), where \(r = \sqrt{x^2 + y^2 + z^2}\). Describe its level surfaces.
Show solution
- \(V = c\) means \(r = k_e q / c\), a constant.
- So each level surface is a sphere centred on the charge.
Answer: Concentric spheres, called equipotential surfaces (PHYS-131). Higher potential corresponds to smaller spheres, closer to a positive charge
Engineering models routinely have many more variables. The ideal gas law \(P = nRT/V\) has three; the cost of a pipeline depends on diameter, wall thickness, length, material and pump power. The calculus you learn for two and three variables extends directly to any number, which is why the methods of this course underpin optimization software that handles thousands.
Worked problem
Ideal gas as a function of two variables
For one mole of ideal gas, \(P(V, T) = RT/V\) with \(R = 8.314\) J/(mol·K). Find P at \(T = 300\) K and \(V = 0.025\) m³, and describe the level curves of P.
Show solution
- \(P = 8.314 \times 300/0.025 = 99\,768\) Pa, about 99.8 kPa (close to atmospheric).
- Level curves \(P = k\): \(T = kV/R\), straight lines through the origin of the VT-plane. In the more familiar PV-plane, the curves of constant T (isotherms) are hyperbolas \(PV = RT\).
Answer: 99.8 kPa. Thermodynamics diagrams are contour maps of exactly this kind
Limits and continuity
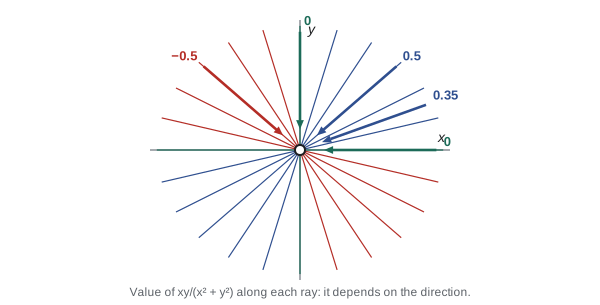
The limit \(\lim_{(x,y)\to(a,b)} f(x, y) = L\) means that \(f(x, y)\) gets arbitrarily close to \(L\) as \((x, y)\) gets close to \((a, b)\), by any route. This last phrase is the new difficulty. On a line you can approach a point only from the left or the right. In the plane you can approach along any line, any curve, or a spiral, and the limit exists only if every route gives the same value.
Most functions built from polynomials, roots, exponentials and trigonometric functions are continuous wherever they are defined, so their limits are found by substitution. The interesting cases are points where the formula breaks down, typically where a denominator is zero.
Worked problem
A limit that does not exist
Does \(\displaystyle\lim_{(x,y)\to(0,0)} \frac{xy}{x^2 + y^2}\) exist?
Show solution
- Approach along the x-axis (\(y = 0\)): \(f = 0/x^2 = 0\).
- Approach along the line \(y = x\): \(f = x^2/(2x^2) = 1/2\).
- More generally, along \(y = mx\): \(f = mx^2/(x^2 + m^2x^2) = m/(1 + m^2)\), which depends on the direction \(m\).
Answer: No. Different paths give different values (0 along the axes, 1/2 along y = x), so the limit does not exist. Showing two paths with different limits is the standard way to prove non-existence
The converse is not true: checking every straight line is not enough, because a function can agree along all lines and still fail along a curve such as \(y = x^2\). To prove that a limit does exist, bound the function. Polar coordinates are often the easiest way.
Worked problem
A limit that does exist
Find \(\displaystyle\lim_{(x,y)\to(0,0)} \frac{x^2 y}{x^2 + y^2}\).
Show solution
- Use polar coordinates \(x = r\cos\theta\), \(y = r\sin\theta\), so \(x^2 + y^2 = r^2\):
- \[\frac{x^2y}{x^2 + y^2} = \frac{r^3\cos^2\theta\sin\theta}{r^2} = r\cos^2\theta\sin\theta\]
- Since \(|\cos^2\theta\sin\theta| \le 1\), the absolute value is at most \(r\), which goes to 0 as \((x, y) \to (0, 0)\), whatever the direction.
Answer: The limit is 0. The extra power of r in the numerator forces the function to zero from every direction
A function is continuous at a point if its limit there equals its value. Continuity matters in engineering because many results, including the existence of a maximum on a closed region (used for optimization in Lesson 2), depend on it, and because numerical methods behave badly near discontinuities such as cracks in a solid or shocks in a gas flow.
Common mistakes
MistakeIgnoring the domain, or the range of validity of an empirical formula.
InsteadState the domain from the formula and the physics; do not use fitted formulas outside the data they came from.
MistakeConfusing a level curve with the graph.
InsteadThe graph is a surface in 3D; a level curve is a curve in the xy-plane where the function equals a constant.
MistakeConcluding a limit exists because it is the same along two or three lines.
InsteadAgreement along paths proves nothing; prove existence by bounding the function (polar coordinates help).
MistakeReading contour maps without noting the interval.
InsteadSlope depends on the contour interval and spacing; check the map scale and the interval.
MistakeTreating close contours as high values.
InsteadClose contours mean rapid change, not large values.
MistakeMixing units in empirical formulas (wind speed in m/s in a km/h formula).
InsteadUse the units the formula was fitted in.
Summary and key terms
- A function of two variables assigns z = f(x, y) to each point of its domain; its graph is a surface.
- Planes, paraboloids, saddles, cones and spheres are the common surfaces.
- Level curves f(x, y) = k form a contour map; close contours mean rapid change.
- Functions of three variables are pictured by level surfaces f(x, y, z) = k.
- A limit in the plane must be the same along every path; two paths with different values show it does not exist.
- Polar coordinates and bounding are the usual way to prove a limit exists.
- Combinations of standard functions are continuous wherever they are defined.
- Function of two variables
- A rule assigning a number f(x, y) to each point of a domain in the plane.
- Domain
- The set of inputs for which a function is defined.
- Graph (surface)
- The set of points (x, y, f(x, y)) in three dimensions.
- Level curve
- The curve where f(x, y) equals a constant.
- Contour map
- A plot of several level curves at regular intervals.
- Level surface
- The surface where f(x, y, z) equals a constant.
- Saddle
- A surface that curves up in one direction and down in another.
- Limit
- The value f approaches as (x, y) approaches a point along every path.
- Continuous function
- A function whose limit at each point equals its value there.
Practice problems
Work each problem on paper first, then reveal the answer to check.
Find the domain of \(f(x, y) = \dfrac{1}{x^2 - y}\).
Show answer
All points with y ≠ x², i.e. the plane with the parabola y = x² removed.
Find the domain and range of \(f(x, y) = \sqrt{x - y^2}\).
Show answer
Domain x ≥ y² (the region inside and on the parabola opening right). Range z ≥ 0.
Compute the wind chill for T = −10 °C and V = 50 km/h.
Show answer
50^0.16 = 1.8687. W = 13.12 − 6.215 − 21.25 − 7.41 = −21.8, about −22.
Describe the level curves of \(f(x, y) = 2x + 3y\).
Show answer
Parallel straight lines 2x + 3y = k, all with slope −2/3.
Describe the level curves of \(f(x, y) = x^2 - y^2\) for k = 1, 0 and −1.
Show answer
k = 1: hyperbola opening left and right; k = 0: the lines y = ±x; k = −1: hyperbola opening up and down.
On a 1:50 000 map with 20 m contours, adjacent contours are 2 mm apart. Find the grade.
Show answer
Horizontal 2 × 50 000 mm = 100 m; grade 20/100 = 20%.
Describe the level surfaces of \(f(x, y, z) = x^2 + y^2\).
Show answer
Circular cylinders about the z-axis (and the z-axis itself for k = 0).
Show that \(\lim_{(x,y)\to(0,0)} \dfrac{x^2 - y^2}{x^2 + y^2}\) does not exist.
Show answer
Along y = 0 the value is 1; along x = 0 it is −1. Different paths, different values.
Find \(\lim_{(x,y)\to(0,0)} \dfrac{x^3 + y^3}{x^2 + y^2}\).
Show answer
Polar: r(cos³θ + sin³θ), bounded by 2r → 0. The limit is 0.
Find \(\lim_{(x,y)\to(1,2)} (x^2y + 3y)\).
Show answer
The function is a polynomial, so substitute: 2 + 6 = 8.
Lesson quiz · 5 questions
Score 60% or more to complete this lesson.
Create a free account to save your progress, take quizzes and earn a certificate.