
BUS-220 · Lesson 7 of 12 · 36 min
Product and brand decisions
Product is usually the first and most basic marketing consideration. A product is anything that can be offered to a market for attention, acquisition, use or consumption that might satisfy a want or need. Products include physical goods, services, events, people, places, organizations and ideas, as well as combinations of these. This lesson looks at how marketers think about products at several levels, the decisions they make about individual products, product lines and product mixes, how new products are developed and how products change over their life cycle. It then turns to branding, one of the most valuable assets a firm can own. Services, which have special characteristics, are covered in lesson 8.
Levels of product
Product planners think about products and services on three levels, each adding more customer value. The core customer value answers the question: what is the buyer really buying? A person buying a smartphone is buying communication, information, entertainment and connection, not a slab of glass and metal. The actual product turns the core benefit into something tangible, with features, design, a quality level, a brand name and packaging. The augmented product adds services and benefits around the core and actual product, such as warranties, delivery, installation, customer support, software updates and financing.
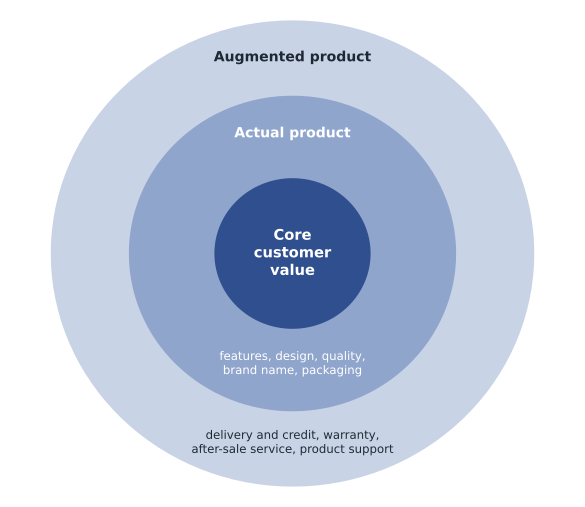
Competition increasingly takes place at the augmented level. When actual products become similar, firms differentiate with service, convenience, guarantees and experiences. A smartphone maker that promises five or seven years of software updates is augmenting its product in a way that changes the customer's cost of ownership and confidence.
Product classifications
Products and services fall into two broad classes based on who uses them. Consumer products are bought by final consumers for personal consumption. Marketers usually classify them by how consumers buy them. Convenience products are bought frequently, immediately and with minimal comparison, such as milk, toothpaste and transit fares; they need wide distribution and low prices. Shopping products are bought less often, with careful comparison of suitability, quality, price and style, such as furniture, clothing and major appliances; they are sold through fewer outlets with deeper sales support. Specialty products have unique characteristics or brand identification for which a significant group of buyers will make a special purchase effort, such as luxury watches or a particular brand of camera. Unsought products are products the consumer either does not know about or does not normally think of buying, such as life insurance, funeral planning and blood donation; they need a lot of advertising, personal selling and other marketing effort.
| Type | Buying behavior | Price | Distribution | Promotion | Examples |
|---|---|---|---|---|---|
| Convenience | Frequent, little planning or comparison | Low | Widespread, convenient locations | Mass promotion by the producer | Milk, snacks, detergent |
| Shopping | Less frequent, much comparison of price, quality, style | Higher | Selective, fewer outlets | Advertising and personal selling | Appliances, furniture, clothing |
| Specialty | Strong brand preference and loyalty; special effort | High | Exclusive, one or a few outlets per area | Carefully targeted promotion | Luxury goods, specialist equipment |
| Unsought | Little awareness or interest | Varies | Varies | Aggressive advertising and personal selling | Life insurance, pre-planned funerals |
Industrial products are bought for further processing or for use in conducting a business. The three groups are materials and parts (raw materials and manufactured materials and components), capital items (installations such as factories and accessory equipment such as tools and computers) and supplies and services (operating supplies, maintenance and repair items, and business advisory services). Lesson 5 described how such products are bought.
Individual product decisions
Marketers make decisions about product attributes, branding, packaging, labeling and product support services. Product quality has two dimensions: level and consistency. Quality level is performance quality, the product's ability to perform its functions. Not every product needs the highest possible quality level; the target market and competitors determine the right level. Quality consistency, or conformance quality, means freedom from defects and consistency in delivering the targeted level. Total quality management and continuous improvement programs aim at consistency, and BUS-230 covers quality management in operations.
Product features are a competitive tool for differentiating the firm's product. A company can create higher-level models by adding features, but each feature should be assessed for the value it adds to customers against its cost to the company. Product style and design are another way to add customer value. Style describes appearance; design goes deeper, to the heart of a product, contributing to usefulness as well as looks. Good design starts with a deep understanding of customer needs and experiences, an approach often called design thinking.
Packaging involves designing and producing the container or wrapper for a product. Its primary function was to hold and protect the product, but packaging has become an important marketing tool, especially for products sold in self-service stores, where the package must attract attention, describe the product and make the sale in a few seconds. Packaging also carries environmental responsibilities, and extended producer responsibility rules in several provinces and states are pushing firms to use less and more recyclable packaging.
Labels identify the product or brand, describe several things about it and promote it. In the United States, the Fair Packaging and Labeling Act requires consumer commodities to show the product identity, net quantity and the name and place of business of the manufacturer, packer or distributor. Food labels must follow Food and Drug Administration rules, including the Nutrition Facts panel and allergen labeling; the FDA proposed a front-of-package 'Nutrition Info box' in January 2025, rating saturated fat, sodium and added sugars as low, medium or high, but had not finalized it as of mid-2026. 'Made in USA' claims must meet the FTC's standard that the product be 'all or virtually all' made in the United States.
Product support services are part of the augmented product. A company should periodically survey customers to assess the value of current services and to obtain ideas for new ones, and then design a mix of services that both delights customers and yields profits. Many firms now use a combination of phone, chat, online self-service and AI assistants, but customers still expect easy access to a human when problems are complex.
Product line and product mix decisions
A product line is a group of products that are closely related because they function in a similar manner, are sold to the same customer groups, are marketed through the same types of outlets or fall within given price ranges. The major product line decision involves product line length, the number of items in the line. A line is too short if the manager could increase profits by adding items, and too long if profits could increase by dropping items. A firm can lengthen its line in two ways. Line stretching means adding products beyond the current range: downward (a premium car brand adding an entry-level model), upward (a mass brand adding a premium line) or both ways. Line filling means adding more items within the present range, for example more sizes or varieties, to reach extra profit, use excess capacity or plug holes that competitors might use. Line filling is overdone if it causes cannibalization, where new items mainly take sales from existing ones, and confuses customers.
An organization with several product lines has a product mix, or product portfolio, consisting of all the product lines and items it offers. The mix has four dimensions. Width is the number of different product lines. Length is the total number of items within all lines. Depth is the number of versions offered of each product in the line. Consistency is how closely related the lines are in end use, production requirements, distribution channels or other ways.
Worked problem
Describing a product mix
A personal-care company sells four product lines: shampoo (5 products, each in 3 sizes), conditioner (4 products, each in 2 sizes), body wash (6 products, each in 2 sizes) and deodorant (3 products, each in 4 versions). Calculate the width, length and average depth of the product mix.
Show solution
- Width = number of lines = 4.
- Length = total products = 5 + 4 + 6 + 3 = 18.
- Total versions = 5×3 + 4×2 + 6×2 + 3×4 = 15 + 8 + 12 + 12 = 47.
- Average depth = 47 ÷ 18 ≈ 2.6 versions per product.
- Consistency is high: all lines are personal-care products sold through the same retailers.
Answer: The mix has a width of 4, a length of 18 and an average depth of about 2.6, with high consistency.
New product development
A firm can obtain new products through acquisition (buying a whole company, a patent or a license) or through its own new product development. New products are vital: firms that do not develop them risk being left behind as needs, technologies and competitors change. Yet new products often fail, through overestimating market size, poor design, wrong positioning, bad timing, too high a price, poor advertising or higher development costs than expected. A systematic process improves the odds.
| Stage | Purpose | Key question |
|---|---|---|
| Idea generation | Search for ideas from customers, employees, suppliers, competitors and crowdsourcing | What problems could we solve? |
| Idea screening | Drop poor ideas early, using criteria such as fit, market size and feasibility | Is this worth pursuing? |
| Concept development and testing | Develop detailed versions of the idea and test them with target customers | Do customers understand and want it? |
| Marketing strategy development | Outline target market, positioning, price, distribution and budget | How would we bring it to market? |
| Business analysis | Review projected sales, costs and profits | Will it meet our objectives? |
| Product development | Build prototypes and test them functionally and with customers | Can we make it work and work well? |
| Test marketing | Introduce the product and program in realistic market settings | How will the market respond? |
| Commercialization | Launch the product | When, where, to whom and how? |
Many firms manage this process through a stage-gate system, in which the project must pass a review at the end of each stage before more money is committed. Others use more iterative, agile approaches borrowed from software development, building a minimum viable product, testing it quickly with real customers and improving it in short cycles. Whatever the method, customer-centered development, which focuses on finding new ways to solve customer problems and create more satisfying experiences, consistently outperforms development driven only by internal technology or engineering interests.
The business analysis stage often includes a break-even calculation, which tells managers how many units must be sold to cover the fixed costs of launch. Lesson 9 uses break-even analysis for pricing; here it helps decide whether a product is worth launching at all.
Worked problem
Break-even for a new product launch
A kitchenware company is considering a new insulated lunch container. Development, tooling and launch marketing will cost $480,000. It expects to sell to retailers at $18 a unit, with variable costs of $10 a unit. Research suggests first-year retail demand of 45,000 to 70,000 units. Calculate the break-even volume and assess the risk.
Show solution
- Unit contribution = $18 − $10 = $8.
- Break-even volume = $480,000 ÷ $8 = 60,000 units.
- The break-even point sits in the upper half of the expected range (45,000 to 70,000).
- At 45,000 units the firm would lose 15,000 × $8 = $120,000; at 70,000 it would earn 10,000 × $8 = $80,000.
- Options: reduce fixed launch costs, lower unit costs, raise price if positioning allows, or plan sales over two years rather than one.
Answer: The product needs 60,000 units to break even, near the top of forecast demand. Launching as planned is risky; the team should look for ways to lower the break-even point first.
The product life cycle
After launch, management wants the product to enjoy a long and profitable life. The product life cycle (PLC) describes the course of a product's sales and profits over its lifetime. In the product development stage, sales are zero and investment costs mount. Introduction is a period of slow sales growth as the product is launched; profits are negative or low because of heavy distribution and promotion costs. Growth is a period of rapid market acceptance and rising profits, as early adopters are joined by the majority and competitors enter. Maturity is a period of slowing sales growth because the product has achieved acceptance by most potential buyers; profits level off or decline as marketing outlays rise to defend the product against competition. Decline is the period when sales fall off and profits drop.
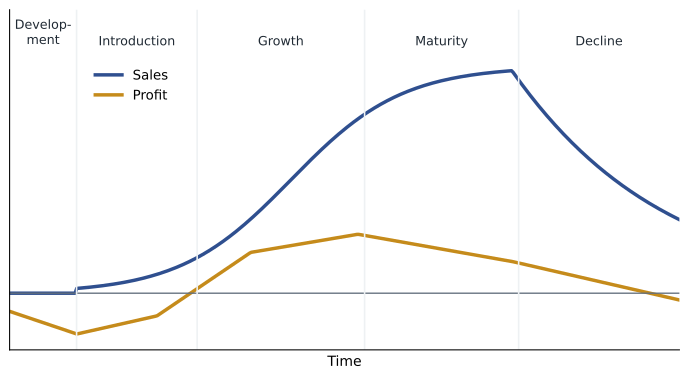
| Stage | Sales | Profits | Customers | Marketing objective |
|---|---|---|---|---|
| Introduction | Low | Negative | Innovators | Create awareness and trial |
| Growth | Rapidly rising | Rising | Early adopters | Maximize market share |
| Maturity | Peak | High but leveling | Middle majority | Maximize profit while defending share |
| Decline | Falling | Declining | Laggards | Reduce spending and milk the brand, or reposition |
The PLC concept can describe a product class (gasoline cars), a product form (SUVs) or a brand. It is useful for describing how products and markets work, but it is hard to use for forecasting, because the shape and length of each stage vary widely and the stages are only clear in hindsight. Marketing actions also shape the cycle: a mature product can be revived by modifying the market (finding new users or uses), modifying the product (new features or quality) or modifying the marketing mix.
The Bass diffusion model, proposed by Frank Bass in 1969, gives a mathematical shape to the growth of a new product. New adopters in each period come from two sources: innovators, who adopt independently at a rate p (the coefficient of innovation), and imitators, who adopt because of contact with previous adopters at a rate q (the coefficient of imitation) multiplied by the share of the market that has already adopted. When q is much larger than p, sales start slowly, accelerate as word of mouth spreads and then decline as the market saturates. The code below simulates an illustrative product with a market potential of one million adopters.
# Bass diffusion model, illustrative parameters
m = 1_000_000      # market potential (total eventual adopters)
p, q = 0.03, 0.38  # innovation and imitation coefficients
cumulative = 0
peak_year, peak_sales = 0, 0
print("Year  New adopters  Cumulative  % of potential")
for year in range(1, 16):
    new = (p + q * cumulative / m) * (m - cumulative)
    cumulative += new
    if new > peak_sales:
        peak_year, peak_sales = year, new
    print(f"{year:4d}  {new:12,.0f}  {cumulative:10,.0f}  {cumulative / m:6.1%}")
print(f"Peak sales in year {peak_year}: {peak_sales:,.0f} adopters")Year New adopters Cumulative % of potential 1 30,000 30,000 3.0% 2 40,158 70,158 7.0% 3 52,685 122,843 12.3% 4 67,261 190,104 19.0% 5 82,803 272,907 27.3% 6 97,216 370,123 37.0% 7 107,486 477,609 47.8% 8 110,481 588,090 58.8% 9 104,409 692,499 69.2% 10 90,144 782,643 78.3% 11 71,164 853,806 85.4% 12 51,818 905,624 90.6% 13 35,310 940,934 94.1% 14 22,891 963,825 96.4% 15 14,334 978,160 97.8% Peak sales in year 8: 110,481 adopters
In the simulation, annual adoptions climb for several years, peak and then fall as fewer potential buyers remain. Researchers have estimated typical values of p around 0.03 and q around 0.38 across many consumer durables, although actual values vary widely by category. Marketers use the model to plan production capacity and to anticipate the point at which growth will slow and the product will enter maturity.
Branding
A brand is a name, term, sign, symbol or design, or a combination of these, that identifies the maker or seller of a product or service. Consumers view a brand as an important part of a product, and branding can add value: people may happily pay more for a familiar brand they trust than for an identical unbranded product. Brands are more than names and symbols; they represent consumers' perceptions and feelings about a product and its performance, everything the product or service means to consumers.
Brand equity is the differential effect that knowing the brand name has on customer response to the product and its marketing. A powerful brand has high brand equity: customers are more aware of it, more loyal to it, more willing to pay a premium and more receptive to its extensions. Kevin Lane Keller's customer-based brand equity model describes building a brand as a ladder: first establish identity (salience: do people know the brand and what category it belongs to?), then meaning (performance and imagery), then responses (judgments and feelings) and finally relationships (resonance: loyalty, attachment, community and active engagement).
Major brand strategy decisions include brand positioning (lesson 6), brand name selection, brand sponsorship and brand development. A good brand name suggests something about the product's benefits and qualities, is easy to pronounce, recognize and remember, is distinctive, is extendable, translates well into other languages and can be registered and legally protected. Teams now also check whether the matching website domain and social media handles are available.
In the United States, trademarks can be registered with the US Patent and Trademark Office under the Lanham Act, giving nationwide rights and the presumption of ownership; common-law rights also arise from use in commerce, but only in the area where the mark is used. Registrations must be maintained with periodic filings and can last indefinitely while the mark is in use. Brand teams should search existing federal, state and common-law marks before committing to a name. BUS-210 lesson 12 outlines intellectual property law.
Brand sponsorship options include manufacturer's brands (national brands), private brands (also called store brands or private labels), licensed brands and co-brands. Private labels have grown strongly, particularly when household budgets are tight; retailers such as large grocery and warehouse chains now offer store brands from basic value lines to premium ranges that compete directly on quality. For retailers, private labels often carry higher margins and build store loyalty. Licensing lets a firm use names or symbols created by others, such as characters from films, for a fee. Co-branding combines established brands of two companies on the same product.
Worked problem
Why retailers like private labels
A grocery chain sells a national brand of cereal at $6.00, which it buys for $4.50. It introduces a comparable store brand, sourced for $2.40, at $4.50. Suppose that of every 100 boxes previously sold of the national brand, 30 switch to the store brand while 70 stay with the national brand, and total volume is unchanged. Compare gross profit per 100 boxes before and after.
Show solution
- Before: 100 × ($6.00 − $4.50) = $150.
- After: national brand 70 × $1.50 = $105; store brand 30 × ($4.50 − $2.40) = 30 × $2.10 = $63.
- Total after = $105 + $63 = $168, an increase of $18 (12 %) per 100 boxes.
- Shoppers who switch also save $1.50 a box, which can increase loyalty to the store rather than to the cereal brand.
Answer: Even though the store brand sells at a lower price, its higher unit margin raises the retailer's gross profit by about 12 % and builds store loyalty, explaining why retailers push private labels.
Finally, a company has four choices for developing brands. Line extensions add new forms, colors, sizes, ingredients or varieties of an existing product category under the same brand name. Brand extensions use a successful brand name to launch new products in a new category. Multibrands introduce additional brands in the same category, letting a company appeal to different segments and secure more shelf space. New brands are created when the firm enters a new category for which none of its current brand names fits. Extensions carry risks: too many can dilute a brand's meaning, and a failure can damage the parent brand.
Common mistakes
MistakeThinking of a product only as its physical features.
InsteadConsider core customer value and the augmented product, where competition is increasingly decided.
MistakeAdding features because competitors have them.
InsteadAssess each feature's value to customers against its cost.
MistakeFilling a product line with many near-identical items.
InsteadWatch for cannibalization and customer confusion.
MistakeUsing the product life cycle to forecast exactly when maturity will arrive.
InsteadUse the PLC to describe dynamics and plan responses; stages are clear only in hindsight.
MistakeChoosing a brand name before checking trademarks and domains.
InsteadSearch registers, common-law use, domains and social handles before committing.
MistakeExtending a brand into unrelated categories.
InsteadExtend where the brand's meaning fits; protect the parent brand from dilution.
Summary and key terms
- Products have three levels: core customer value, the actual product and the augmented product.
- Consumer products are convenience, shopping, specialty or unsought; industrial products are materials and parts, capital items, or supplies and services.
- Individual product decisions cover quality, features, design, branding, packaging, labeling and support services.
- Product lines can be stretched or filled; the product mix has width, length, depth and consistency.
- New product development moves from idea generation to commercialization; break-even analysis tests viability.
- The product life cycle has introduction, growth, maturity and decline stages; the Bass model describes diffusion through innovation and imitation.
- Brand equity is the differential effect of the brand name on customer response; Keller's model builds from salience to resonance.
- Brand sponsorship includes national brands, private labels, licensing and co-branding; development includes line and brand extensions, multibrands and new brands.
- Product
- Anything offered to a market that might satisfy a want or need.
- Augmented product
- Additional services and benefits built around the core and actual product.
- Shopping product
- A consumer product bought after comparing suitability, quality, price and style.
- Product line
- A group of closely related products.
- Line filling
- Adding more items within the present range of a product line.
- Product mix width
- The number of different product lines a company carries.
- Product life cycle
- The course of a product's sales and profits over its lifetime.
- Brand equity
- The differential effect that knowing the brand name has on customer response.
- Private label
- A brand created and owned by a reseller.
- Brand extension
- Using a successful brand name to launch products in a new category.
Practice problems
Work each problem on paper first, then reveal the answer to check.
Identify the core value of a home-security system.
Show answer
Peace of mind and safety.
Classify a funeral pre-planning service.
Show answer
An unsought product.
A product line has 8 items; 2 more sizes are added in the same price range. What is this?
Show answer
Line filling.
A company has 3 lines with 4, 6 and 5 products. What are width and length?
Show answer
Width 3; length 15.
Fixed costs are $200,000, price $25, variable cost $15. What is break-even volume?
Show answer
20,000 units.
In which PLC stage are profits usually highest?
Show answer
Late growth or early maturity.
In the Bass model, what does q represent?
Show answer
The coefficient of imitation, adoption driven by previous adopters.
Name the four steps of Keller's brand equity ladder.
Show answer
Identity (salience), meaning, responses, relationships (resonance).
Why might a retailer favor its private label?
Show answer
Higher margins and greater store loyalty.
Portfolio task: evaluate a recent brand extension and judge whether it fits the parent brand.
Show answer
Answers vary; a good answer uses fit, risk of dilution and customer value.
Lesson quiz · 5 questions
Score 60% or more to complete this lesson.
Create a free account to save your progress, take quizzes and earn a certificate.