
CON-210 · Lesson 9 of 12 · 34 min
Linear and location-based scheduling
Much construction work is repetitive. A high-rise building repeats the same sequence of trades floor after floor; a highway, pipeline or rail line repeats the same operations kilometer after kilometer; a housing development repeats the same house dozens of times. Critical path networks can model repetitive work, but they do it clumsily, with hundreds of near-identical activities and a bar chart that hides the most important question: are the crews moving through the locations at rates that keep them working continuously without running into each other? Linear and location-based scheduling methods answer that question directly by plotting work against both time and location. This lesson introduces line of balance, flowline and time-location charts, and takt planning, which the lean construction course (CON-410) develops further.
The problem with networks for repetitive work
Imagine scheduling eight stories of interior work with four trades. A CPM schedule needs 32 activities and dozens of links, and the bar chart becomes a staircase of short bars that is hard to read. More importantly, the CPM calculation starts every activity as early as logic allows. If a faster trade follows a slower one, it catches up, waits, works, waits again: the crew starts and stops, remobilizes, and loses productivity. The network shows no problem, because waiting time is invisible in it.
Location-based methods treat the rate of progress, called the production rate, as the central variable, and aim for continuous work by each crew through the locations. The goal is a schedule in which each trade starts once, works steadily through all the locations, and leaves, with the trades spaced so that they never interfere.
Time-location charts
In a time-location chart, also called a flowline chart or line-of-balance chart, the horizontal axis is time and the vertical axis is location: floors of a building, chainage along a road, or units in a development. Each trade's work is drawn as a line or band from its start location and time to its finish location and time. The slope of the line is the production rate: steeper lines are faster trades. When two lines converge, the following trade is catching up with the one ahead; when they cross, the schedule is impossible, because the second trade would be working in a location before the first has finished there.
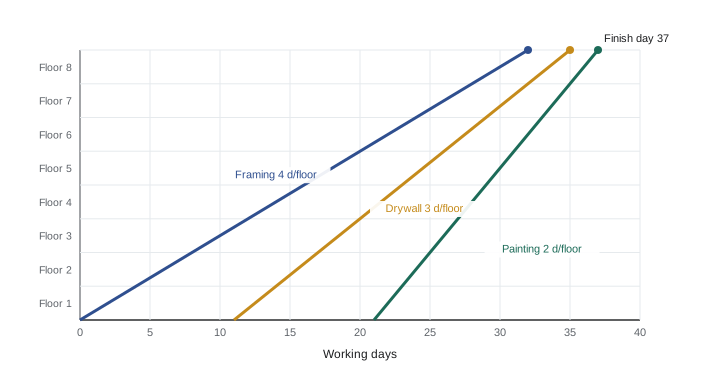
Time-location charts make problems visible at a glance: a trade that is too slow, a following trade that will catch up, a location where many trades are crammed at once, or a gap where nothing is happening. They are widely used for highways, railways, pipelines, tunnels and high-rise buildings, and many scheduling programs can now draw them from the same data as the CPM network.
Production rates and continuous work
The production rate of a trade is the number of locations, or the length or quantity, it completes per unit of time. It depends on crew size: two crews will usually progress about twice as fast as one, up to the limits of space. The key planning rule is that when a faster trade follows a slower one, the faster trade must start later than it would in a CPM schedule, so that it reaches the last location just as the slower trade finishes there. When a slower trade follows a faster one, the gap between them grows over time, and the slower trade can start as soon as the first location is free.
Worked problem
Planning continuous trades on eight floors
Eight floors receive framing (4 days per floor), then drywall (3 days per floor), then painting (2 days per floor). Each trade must finish a floor before the next trade starts it, and each trade should work continuously once it starts. Framing starts at time 0. When should drywall and painting start, and when does the work finish?
Show solution
- Framing finishes floor k at day 4k, so it finishes floor 8 on day 32.
- Drywall, starting on day s, would start floor k on day s + 3(k − 1). It must not start any floor before framing finishes it: s + 3(k − 1) ≥ 4k, so s ≥ k + 3. The worst case is floor 8: s ≥ 11.
- Drywall therefore starts on day 11 and finishes floor k at 11 + 3k, so floor 8 at day 35.
- Painting, starting on day p, starts floor k at p + 2(k − 1) ≥ 11 + 3k, so p ≥ 13 + k; for floor 8, p ≥ 21.
- Painting runs from day 21 and finishes floor 8 at day 21 + 16 = 37.
Answer: Drywall starts day 11, painting day 21, and all work finishes on day 37, with every crew working continuously.
Compare that with a CPM approach in which each trade starts each floor the moment the previous trade is done. Drywall would start floor 1 on day 4, finish it on day 7, then wait a day for framing to free floor 2, work 3 days, wait another day, and so on. It would finish floor 8 on day 35, exactly as before, but with seven separate pauses. The finish date is the same; the difference is that the continuous plan keeps the drywall crew working without interruption, which in practice means better productivity, fewer remobilizations and a more reliable schedule.
Balancing rates
The most powerful lever in location-based planning is to make the production rates of successive trades similar, by changing crew sizes. When rates match, the lines on the chart are parallel, trades follow each other at a steady distance, and the total duration shrinks because no trade has to wait for a slower one to clear the last location.
Worked problem
Balancing to a common rate
In the previous example, the team adds a framing crew so framing takes 3 days per floor, and reduces the painting crew so painting also takes 3 days per floor. All three trades now take 3 days per floor. Each trade starts a floor as soon as the trade ahead finishes it. When does the work finish?
Show solution
- Framing: floor k occupies days 3(k − 1) to 3k, finishing floor 8 on day 24.
- Drywall: floor k occupies days 3k to 3k + 3, finishing floor 8 on day 27.
- Painting: floor k occupies days 3k + 3 to 3k + 6, finishing floor 8 on day 30.
- Total: 30 days instead of 37, a saving of 7 days, with roughly the same total labor.
- The general formula for equal rates is: duration = (number of locations + number of trades − 1) × time per location = (8 + 3 − 1) × 3 = 30 days.
Answer: 30 days, 7 days faster, by matching the rates of the three trades.
In the formula, \(n\) is the number of locations, \(m\) the number of trades or work steps, and \(t\) the time each trade spends in each location. Reducing the time per location shortens the whole sequence, and adding locations, by splitting large floors into zones, also helps, because smaller locations let more trades work at once in different places.
Buffers
A perfectly tight location-based schedule is fragile: if one trade has a bad day, every following trade is delayed. Planners therefore insert buffers between trades, either as time buffers (a gap of some days between one trade leaving a location and the next arriving) or as location buffers (keeping at least one empty location between trades). Buffers absorb variation and protect the flow, at the cost of a slightly longer total duration.
Worked problem
Adding a buffer
In the balanced 3-day-per-floor schedule with three trades on eight floors, the team adds a 1-day buffer between each pair of trades. What is the new duration?
Show solution
- There are two pairs of trades (framing–drywall and drywall–painting), each with a 1-day buffer.
- Each trade still takes 24 days to work through the 8 floors.
- Drywall starts on day 3 + 1 = 4 and painting on day 4 + 3 + 1 = 8.
- Painting finishes floor 8 on day 8 + 24 = 32.
- The two buffers add 2 days to the 30-day plan.
Answer: 32 days. Buffers add a little time but make the flow much more robust.
Line of balance for linear projects
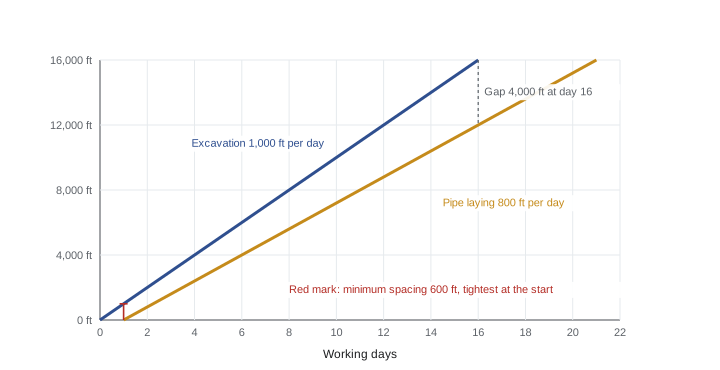
On highways, pipelines and railways, location is a continuous distance, often given as chainage in kilometers or stations in feet. The time-location chart works the same way, with each operation drawn as a line whose slope is its rate in meters or feet per day. Operations that must stay a minimum distance apart, such as excavation ahead of pipe laying or paving ahead of line painting, are shown with a minimum spacing, and the chart reveals where they would come too close.
US road builders usually express location as stations, where one station is 100 ft, so station 123+50 means 12,350 ft from the origin. The time-location chart's vertical axis uses the same station numbers.
Worked problem
Keeping two linear operations apart
On a 16,000 ft pipeline, trench excavation advances 1,000 ft per day and pipe laying 800 ft per day. Pipe laying must stay at least 600 ft behind excavation. Excavation starts at day 0. When should pipe laying start so it never comes closer than 600 ft, and when does the job finish?
Show solution
- Excavation reaches the end after 16,000 ÷ 1,000 = 16 days.
- Pipe laying is slower, so the gap grows over time; the critical point is the start.
- Pipe laying can start when excavation is 600 ft ahead: 600 ÷ 1,000 = 0.6 days, so on day 1 to keep whole days.
- Pipe laying takes 16,000 ÷ 800 = 20 days, so it finishes on day 21.
- Check the end: when excavation finishes on day 16, pipe laying has done 15 × 800 = 12,000 ft, 4,000 ft behind, well over 600 ft.
Answer: Start pipe laying on day 1; the job finishes on day 21. With a slower follower, the spacing rule binds at the start, not the end.
Takt planning
Takt planning, borrowed from manufacturing and widely used in lean construction, sets a single rhythm, the takt time, for the whole sequence. The building is divided into zones of roughly equal work content, and every trade is sized to complete its work in each zone within the takt time, then move to the next zone, like cars moving along an assembly line. A typical building takt might be one zone per week or per three days. Trades move together in a train of wagons, each wagon a work step, and the whole train advances one zone each takt period.
Takt planning makes the schedule highly visible and predictable, exposes bottlenecks immediately and encourages trades to plan their crews to the rhythm. It requires careful zoning, balanced work content, and trades willing to adjust crew sizes. It also depends on reliable short-term planning, such as the Last Planner System, so that each zone is truly ready when its takt period begins. The lean construction course covers these methods in depth.
Worked problem
Choosing a takt time
A four-story building has 4 floors of about 1,200 labor-hours of interior work per trade per floor for the slowest trade, drywall. The drywall contractor can supply up to 6 workers per zone on 8-hour days, 5 days per week. The team divides each floor into 2 zones of equal content. What is the shortest practical takt time for drywall, in working days per zone?
Show solution
- Work per zone: 1,200 ÷ 2 = 600 labor-hours.
- Crew capacity per day: 6 × 8 = 48 labor-hours.
- Days per zone: 600 ÷ 48 = 12.5, rounded up to 13 working days.
- Unless the zones are made smaller or more workers can fit, drywall sets a takt of about 13 days, and the other trades should be sized to match.
Answer: About 13 working days per zone; to shorten it, use smaller zones or larger crews if space allows.
Combining methods
Location-based methods do not replace the critical path method; they complement it. Most building projects use a CPM network for the overall schedule, including procurement, approvals and non-repetitive work, and a location-based plan for repetitive interior or structural work. Some scheduling software integrates the two, letting the same activities be viewed as a network, a bar chart or a flowline chart. Contracts and owners usually still require a CPM schedule for submittals and delay analysis, so the location-based plan must be consistent with it.
Common mistakes
MistakeStarting a faster trade as early as logic allows behind a slower one.
InsteadDelay its start so it works continuously and reaches the last location as the slower trade finishes.
MistakeLetting flowlines cross.
InsteadAdjust start times or rates so no trade enters a location before the previous trade is done.
MistakeIgnoring the benefit of balancing rates.
InsteadAdjust crew sizes so successive trades progress at similar rates.
MistakePlanning without buffers.
InsteadAdd time or location buffers to absorb variation.
MistakeUsing only a bar chart for repetitive work.
InsteadDraw a time-location chart to see rates, convergence and continuity.
Summary and key terms
- Repetitive work is better visualized on time-location charts than on bar charts.
- The slope of a flowline is the production rate; converging lines mean a trade is catching up.
- Faster following trades should start later to work continuously without waiting.
- Balancing rates shortens the sequence: \(T = (n + m - 1)t\) for equal rates.
- Buffers protect the flow at the cost of a little time.
- Line of balance applies the same ideas to roads, pipelines and railways.
- Takt planning sets one rhythm for all trades moving through zones.
- Location-based scheduling
- Scheduling that plans work by location and production rate so crews work continuously.
- Time-location chart
- A chart with time on one axis and location on the other, showing each trade as a line.
- Flowline
- A line on a time-location chart representing one trade moving through locations.
- Line of balance
- A method of scheduling repetitive work by balancing production rates across locations.
- Production rate
- The number of locations or quantity a trade completes per unit time.
- Continuous work
- A trade working through all locations without interruption once started.
- Buffer
- Time or location left between trades to absorb variation.
- Takt time
- The fixed time each trade spends in each zone in a takt plan.
- Zone
- A defined work area used as a location in location-based or takt planning.
- Chainage
- Distance along a linear project from a reference point, used as location.
Practice problems
Work each problem on paper first, then reveal the answer to check.
What does a steeper flowline mean?
Show answer
A faster production rate.
What does it mean when two flowlines cross?
Show answer
The schedule is impossible: a trade would work in a location before the previous trade finished there.
Why should a faster trade start later behind a slower one?
Show answer
So it works continuously instead of catching up and waiting.
Equal rates: 10 floors, 4 trades, 2 days per floor. Total duration?
Show answer
(10 + 4 − 1) × 2 = 26 days.
How can a slow trade's rate be increased?
Show answer
Add crews or workers if space allows, or split locations into smaller zones.
What is a location buffer?
Show answer
An empty location kept between trades to absorb variation.
Why are time-location charts popular for highways?
Show answer
They show each operation's progress along the route and where operations would come too close.
What is takt time?
Show answer
The fixed time each trade spends in each zone in a takt plan.
A zone needs 400 labor-hours; a crew of 5 works 8-hour days. Days per zone?
Show answer
10 days.
Do location-based methods replace CPM?
Show answer
No; they complement it, especially for repetitive work.
Lesson quiz · 5 questions
Score 60% or more to complete this lesson.
Create a free account to save your progress, take quizzes and earn a certificate.