
CON-410 · Lesson 1 of 12 · 27 min
The productivity problem in construction
Construction builds the houses, schools, hospitals, roads and plants that every other industry depends on, yet by most measures it has improved its own productivity far more slowly than the rest of the economy. Factories now produce cars, phones and furniture with a fraction of the labor they needed fifty years ago. Building a house, a parking structure or a school still takes roughly as many worker-hours as it did a generation ago, and in some measurements more. This course is about the management ideas, collectively called lean construction, that try to close that gap: designing work so that it flows, planning so that crews can actually do what they promise, and measuring and improving the way work is done in the field. This first lesson sets out the size of the problem, its causes and why planning and flow matter more than effort.
What productivity means
Productivity is output divided by input. At the scale of a national economy, labor productivity is usually real value added per hour worked: the value the industry adds, adjusted for inflation, divided by the hours its workers put in. At the scale of a project, productivity is measured in physical units: square meters of drywall hung per worker-hour, cubic meters of concrete placed per crew-day, or suites finished per week. Both views matter, but they measure different things and are easy to confuse.
| Level | Typical measure | Who uses it | Main weakness |
|---|---|---|---|
| Industry | Real value added per hour worked | Statistical agencies, economists | Depends on price deflators that are hard to build for unique buildings |
| Company | Revenue or margin per employee or per labor hour | Owners, executives | Mixes productivity with pricing and subcontracting |
| Project | Earned hours per actual hour (performance factor) | Project managers, cost engineers | Depends on the quality of the budgeted hours |
| Activity | Units installed per worker-hour (unit rate) | Superintendents, estimators | Ignores whether the work was needed or done right |
At the activity level, productivity is often expressed as its inverse, a unit rate in worker-hours per unit. If a framing crew installs 180 meters of steel stud wall in 60 worker-hours, its unit rate is 0.33 worker-hours per meter, or its productivity is 3 meters per worker-hour. CON-310 covers how these rates feed the cost report; this course is about why they are what they are and how to improve them.
The long-run record
US data tell a similar story. Bureau of Economic Analysis figures summarized by the Federal Reserve Bank of Richmond in 2025 show construction labor productivity in 2023 roughly where it was in 1948, while productivity across the whole economy more than tripled; real output per construction worker in 2020 was more than 30 % below its 1970 level. Researchers argue about how much of the decline is real. Measuring the real output of an industry that builds unique products is hard, and price indexes may miss improvements in quality, such as better insulation, accessibility and fire protection. Even generous adjustments, however, leave construction trailing the next-lowest industries by about a percentage point a year.
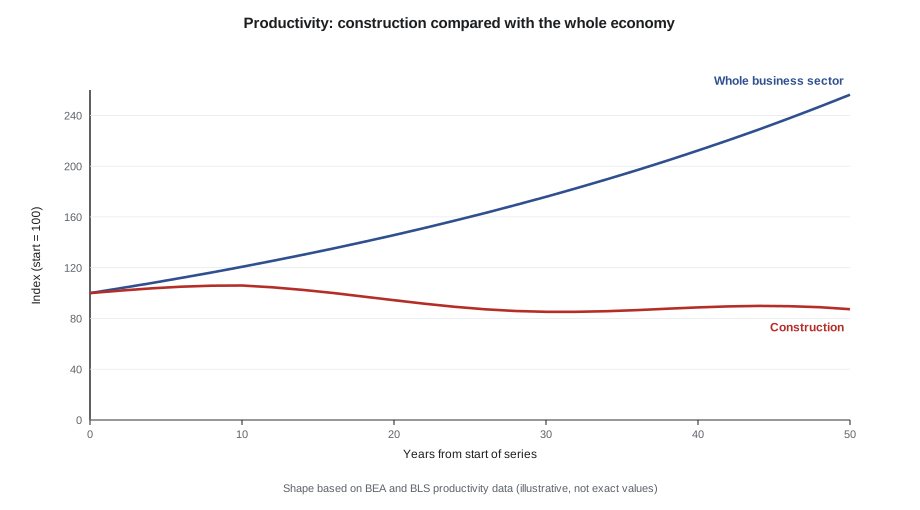
A widely quoted 2017 McKinsey Global Institute report estimated that global construction productivity had grown about 1 % a year over the previous two decades, against about 2.8 % for the world economy and 3.6 % for manufacturing, and that closing the gap could add well over a trillion dollars a year of value. The report is a useful starting point but should be used with care: its figures are estimates built from uneven national data, and its recommendations came from consultants with services to sell. The direction of its findings matches government data in Canada and the United States; the precise numbers should not be quoted as fact.
Why construction is different
Several features of construction make productivity gains harder than in a factory. Each project is a prototype with a new design, team and site. The workplace moves: crews travel to the work rather than the work traveling to fixed stations. Work is exposed to weather. Projects are delivered by a temporary organization of many firms, each with its own contract, crew and goals, so no single party controls the whole flow of work. Margins are thin and work is won by low bids, which discourages investment in equipment, training and research. Demand is cyclical, so firms keep their permanent workforce small and rely on subcontracting, which further fragments the work.
| Feature | Effect on productivity |
|---|---|
| One-off designs | Little repetition to learn from; design errors discovered in the field |
| Moving workplace | Time lost to travel, set-up and searching for materials |
| Weather exposure | Lost days, protection costs, rework |
| Fragmented supply chain | Handoffs between firms; each optimizes its own work |
| Low-bid procurement | Little investment in planning, training and technology |
| Cyclical demand | Small permanent workforces, heavy subcontracting, skill shortages |
| Regulation and approvals | Waiting for permits and inspections; local variation in codes |
None of these features is an excuse. Shipbuilding, aerospace and parts of the oil and gas industry also build large one-off products in difficult conditions and have achieved steady improvements by changing how they plan and organize work. Lean construction borrows heavily from their experience and from the Toyota Production System covered in BUS-230.
Where the time goes
The most striking evidence for the productivity problem comes from watching what tradespeople actually do. Work-sampling studies, in which an observer records at random moments whether each worker is doing direct work, supporting work or something else, have been run on thousands of sites. Results vary widely, but many studies find that skilled trades spend only about a third to a half of their paid time on direct, value-adding work such as setting forms, pulling wire or hanging board. The rest goes to getting materials and tools, waiting for other trades, traveling around the site, receiving instructions, reworking mistakes and taking breaks.
The important lesson is that most of this lost time is not the worker's fault. Workers wait because the previous trade has not finished, because material is not on the floor, because a drawing question has not been answered or because the hoist is busy. They travel because laydown areas are far from the work. They rework because the design changed or the layout was wrong. These are failures of planning and of the system of work. Telling crews to work harder does nothing about them; making sure that every crew starts each day with everything it needs does.
# Where a crew's paid hours go: converting work-sampling shares into hours
# Illustrative observation shares for a 6-person drywall crew over a 40-hour week
shares = {"direct work": 0.38, "material handling": 0.17, "tools and equipment": 0.07,
          "instructions and layout": 0.06, "waiting": 0.12, "travel on site": 0.09,
          "rework": 0.05, "personal and breaks": 0.06}
crew_hours = 6 * 40
assert abs(sum(shares.values()) - 1) < 1e-9
for k, v in shares.items():
    print(f"{k:<26}{v:>6.0%}{v * crew_hours:>8.1f} h")
lost = shares["waiting"] + shares["travel on site"] + shares["rework"]
print(f"Hours lost to waiting, travel and rework: {lost * crew_hours:.1f} of {crew_hours}")
print(f"If half of that were recovered, direct work would rise from {shares['direct work']:.0%} "
f"to {shares['direct work'] + lost / 2:.0%} of paid time")direct work 38% 91.2 h material handling 17% 40.8 h tools and equipment 7% 16.8 h instructions and layout 6% 14.4 h waiting 12% 28.8 h travel on site 9% 21.6 h rework 5% 12.0 h personal and breaks 6% 14.4 h Hours lost to waiting, travel and rework: 62.4 of 240 If half of that were recovered, direct work would rise from 38% to 51% of paid time
The arithmetic shows why planning has such leverage. Recovering half of the waiting, travel and rework on one crew turns about thirty crew-hours of lost time a week into productive time, raising direct work from 38 % to about half of paid time, without anyone working faster. Across a site with two hundred workers, the same improvement is worth thousands of hours a month.
Productivity, schedule and cost
Labor is typically 30 to 50 % of the cost of a building, and an even larger share for trades such as electrical, mechanical and finishing work. A 10 % improvement in field productivity therefore lowers total cost by something like 3 to 5 %, which on many projects is more than the contractor's entire fee. Productivity also drives schedule: a crew that installs more per day finishes sooner, and the general conditions, equipment rental and financing costs that run for every day of the project fall with it. Poor productivity is also the main source of many disputes, because contractors who lose productivity through no fault of their own try to recover it through claims, which CON-420 covers.
Worked problem
The value of a productivity gain
On Willowmere Residences, an invented eight-story building with 84 suites, Northgate Builders estimates 96,000 field labor hours at an average all-in rate of $85 per hour, and general conditions of $95,000 per month over a 20-month schedule. If lean planning improves field productivity by 8 % and shortens the schedule by six weeks, what is the approximate saving?
Show solution
- Labor hours saved: 96,000 × 0.08 = 7,680 hours.
- Labor cost saved: 7,680 × $85 = $652,800.
- Schedule saving: 6 weeks ≈ 1.4 months.
- General conditions saved: 1.4 × $95,000 ≈ $133,000.
- Total: about $652,800 + $133,000 ≈ $786,000.
Answer: About $786,000, roughly 2 % of a $38 million contract, or more than the margin on many projects. The figures are illustrative.
Effort is not the answer
A common response to poor productivity is to push harder: longer shifts, more workers, tighter deadlines, threats of backcharges. These approaches usually make things worse. Overtime beyond short bursts lowers hourly productivity through fatigue. Adding workers to an area that is already congested creates interference. Pressuring a trade to start before its work is ready creates rework and safety risk. Research on construction productivity going back to the 1980s has consistently found that the biggest causes of lost productivity are management factors, such as unavailable materials, incomplete information, crowded work areas and poor sequencing, rather than worker motivation or skill.
| Common response | Typical result | Lean alternative |
|---|---|---|
| Longer shifts and weekend work | Fatigue, falling hourly output, safety incidents | Remove the constraints that cause lost hours |
| More workers in the same area | Stacking of trades, interference | Plan work by zone so each crew has room |
| Start trades early to "get ahead" | Rework when prerequisite work is incomplete | Release work only when it is ready |
| Backcharge slow trades | Adversarial relationships, padding of bids | Make reliable promises and track them |
| Detailed master schedule managed from the office | Plans that do not match field reality | Involve trade forepersons in planning |
What lean construction offers
Lean construction is a set of principles and practices, developed from the 1990s onward by researchers such as Glenn Ballard, Greg Howell and Lauri Koskela and by practitioners in many countries, that applies the ideas of lean production to the design and construction of buildings and infrastructure. Its central insight is that a construction project is a production system: a flow of work from design through procurement to installation, in which each step depends on the steps before it. Managing that flow, by reducing variability, making work ready before it is assigned and learning from every failure to keep a promise, does more for productivity than managing each activity in isolation.
In the United States, the Lean Construction Institute (LCI), founded in 1997, promotes lean practice through training, local communities of practice and an annual congress, and its terminology for the Last Planner System is widely used. Many owners, including health care systems and public agencies, now require or encourage lean practices on their projects, often alongside collaborative delivery methods such as integrated project delivery (CON-340).
| Lesson | Topic |
|---|---|
| 2 | Lean thinking: value and waste |
| 3 | Variability, flow and pull |
| 4 to 6 | The Last Planner System |
| 7 and 8 | Takt planning, line of balance and location-based management |
| 9 | Prefabrication, modular construction and DfMA |
| 10 | Measuring productivity on site |
| 11 | Continuous improvement and lean culture |
| 12 | Capstone: implementing lean on Willowmere Residences |
The course follows one invented project throughout. Willowmere Residences is an eight-story mixed-use building with ground-floor retail and amenity space and seven typical residential floors of twelve suites each, built by the invented general contractor Northgate Builders under a $38 million contract. All of its figures are illustrative.
Common mistakes
MistakeComparing industry productivity statistics as if they measured site performance.
InsteadUse industry data for trends and project or activity measures for site decisions.
MistakeQuoting consultants' estimates of the productivity gap as precise facts.
InsteadTreat them as estimates and check them against government data.
MistakeBlaming low productivity on worker effort.
InsteadLook first at materials, information, access, sequencing and other management factors.
MistakeAdding workers or overtime to recover lost productivity.
InsteadRemove the constraints that cause the lost time; extra hours often lower hourly output.
MistakeTreating each activity separately.
InsteadManage the project as a production system in which work flows between trades.
Summary and key terms
- Productivity is output per unit of input, measured differently at industry, company, project and activity levels.
- National data in Canada and the United States show construction productivity lagging the rest of the economy for decades, though measurement is debated.
- One-off designs, moving workplaces, weather, fragmentation, low-bid procurement and cyclical demand make construction harder to improve.
- Work-sampling studies often find that tradespeople spend only a third to a half of paid time on direct work.
- Most lost time comes from planning and system failures, not worker effort.
- Because labor and time are large shares of cost, modest productivity gains are worth more than many contractors' fees.
- Lean construction treats the project as a production system and manages the flow of work.
- Labor productivity
- Output per hour worked; at industry level, real value added per hour.
- Unit rate
- Worker-hours required per unit of work installed.
- Direct work
- Activity that directly adds value to the product, such as installing material.
- Supporting work
- Activity needed to enable direct work, such as handling materials or setting up tools.
- Work sampling
- A method of estimating how time is spent by recording observations at random moments.
- Lean construction
- The application of lean production principles to design and construction.
- Production system
- The organized flow of work, information and materials that produces a product.
- Value added
- The value of an industry's output minus the value of the inputs it buys from others.
- Price deflator
- An index used to convert nominal output into real output by removing inflation.
- Management factors
- Causes of lost productivity under management control, such as materials, information and sequencing.
Practice problems
Work each problem on paper first, then reveal the answer to check.
A crew installs 240 square meters of ceiling tile in 32 worker-hours. What is its unit rate?
Show answer
32 ÷ 240 ≈ 0.13 worker-hours per square meter.
Why is industry-level construction productivity hard to measure?
Show answer
Each product is unique and price deflators may not capture quality changes.
Name three features of construction that make productivity gains harder.
Show answer
Any three of one-off designs, moving workplace, weather, fragmented supply chain, low-bid procurement, cyclical demand.
A crew of 5 works 45 hours each. Work sampling shows 12 % waiting. How many crew hours were spent waiting?
Show answer
5 × 45 × 0.12 = 27 hours.
Why does overtime often fail to recover lost productivity?
Show answer
Fatigue lowers hourly output and the underlying constraints remain.
Labor is 40 % of a $20 million project. What does a 10 % labor productivity gain save?
Show answer
0.40 × 20 million × 0.10 = $800,000.
What is the central insight of lean construction?
Show answer
A project is a production system; managing flow does more than managing activities in isolation.
Give two management factors that commonly cause lost productivity.
Show answer
Any two of missing materials, incomplete information, congestion, poor sequencing, waiting for inspections.
How should the 2017 McKinsey estimates be used?
Show answer
As a rough indication of direction, checked against government data, not as precise facts.
Why does a productivity gain also save general conditions cost?
Show answer
Faster work shortens the schedule, and time-related costs run for every day of the project.
Lesson quiz · 5 questions
Score 60% or more to complete this lesson.
Create a free account to save your progress, take quizzes and earn a certificate.