
CON-410 · Lesson 3 of 12 · 26 min
Variability, flow and pull
Every construction schedule assumes that work will happen when planned. In reality, crews finish early or late, materials arrive on different days, inspections are passed or failed and weather comes and goes. This variability is not just a nuisance that adds a little uncertainty to the finish date. When trades depend on each other in sequence, variability compounds, and it lowers the output of the whole system even when every crew is working at its normal average pace. This lesson explains why, using a classic simulation called the parade of trades, and shows how flow and pull reduce the damage. It builds on the queueing ideas and Little's Law introduced in BUS-230 lessons 3 and 4.
Dependent events and variability
Imagine five trades that must work through a building in sequence: framing, mechanical rough-in, electrical rough-in, drywall and painting. Each can do, on average, one floor per week. If every trade always did exactly one floor per week, the building would move along smoothly. But suppose each trade's output in any week is uncertain: sometimes they can do more, sometimes less, averaging one floor. A trade can never do more than the work available to it, because it cannot hang board on a floor that has not been roughed in. When an upstream trade has a bad week, the downstream trade loses work it can never recover, even if it has spare capacity later. Gains are capped by what is available; losses pass downstream. The result is that the system as a whole produces less than the average capacity of any single trade.
This effect was described for factories by Eliyahu Goldratt in The Goal (1984), which used a hike of boy scouts and a matchsticks-and-dice game to show how dependent events and statistical fluctuations limit throughput. Iris Tommelein, Glenn Ballard and colleagues adapted the idea for construction in a 1999 study called the parade of trades, in which trades in a building roll dice to set their weekly output.
The parade of trades game
In the parade of trades, each trade rolls a die each week; the number rolled is its capacity that week, in units of work (say, suites or zones). Its actual output is the smaller of its capacity and the work waiting for it. The first trade always has unlimited work available. The average die roll is 3.5, so each trade's average capacity is 3.5 units per week. The question is how many units the last trade completes.
# Parade of trades: five dependent trades, capacity set by a die roll each week (seeded)
import random
def parade(n_trades=5, weeks=20, units=70, dice=(1, 6), seed=410):
    rng = random.Random(seed)
    waiting = [units] + [0] * (n_trades - 1)   # work available to each trade
    done = [0] * n_trades
    for week in range(weeks):
        for t in range(n_trades):
            cap = rng.randint(*dice)
            out = min(cap, waiting[t])
            waiting[t] -= out
            done[t] += out
            if t + 1 < n_trades:
                waiting[t + 1] += out
    return done, waiting

done, wip = parade()
print("Units completed by each trade after 20 weeks:", done)
print("Work in progress stuck between trades:", wip[1:])
print("Average capacity per trade: 3.5 x 20 =", 3.5 * 20)

# Same average capacity (3.5) but far less variability: capacity 3 or 4 each week
done2, wip2 = parade(dice=(3, 4))
print("Low-variability crews, units completed by last trade:", done2[-1])Units completed by each trade after 20 weeks: [67, 61, 61, 53, 48] Work in progress stuck between trades: [6, 0, 8, 5] Average capacity per trade: 3.5 x 20 = 70.0 Low-variability crews, units completed by last trade: 64
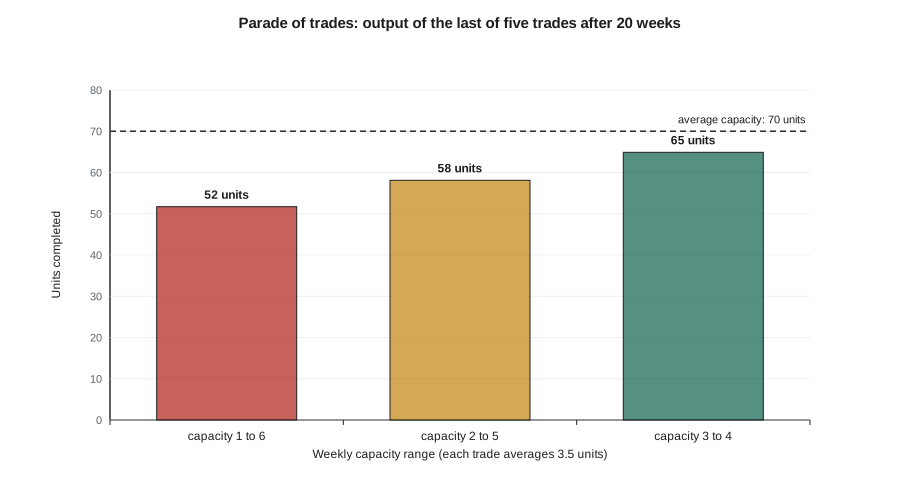
In this run the first trade completes close to its average capacity, but each trade further down the line completes less, and the last trade finishes well short of the 70 units that the average capacity suggests. Work in progress piles up between trades. When the same game is run with crews whose capacity varies only between 3 and 4, the last trade completes much more. Nothing about the crews' average speed changed; only their variability did. Running the game many times with different seeds gives the same pattern.
# Repeat the parade 2,000 times to compare high and low variability (seeded)
import random, statistics
def last_trade(dice, seed, n=5, weeks=20, units=70):
    rng = random.Random(seed)
    waiting = [units] + [0] * (n - 1)
    done = 0
    for _ in range(weeks):
        for t in range(n):
            out = min(rng.randint(*dice), waiting[t])
            waiting[t] -= out
            if t + 1 < n:
                waiting[t + 1] += out
            else:
                done += out
    return done
for dice in ((1, 6), (2, 5), (3, 4)):
    runs = [last_trade(dice, s) for s in range(2000)]
    print(f"capacity {dice}: mean output of last trade {statistics.mean(runs):5.1f} units, "
f"worst 10% {sorted(runs)[200]:3d}")capacity (1, 6): mean output of last trade 51.7 units, worst 10% 45 capacity (2, 5): mean output of last trade 58.1 units, worst 10% 54 capacity (3, 4): mean output of last trade 64.9 units, worst 10% 63
What the parade teaches
The parade of trades has three practical lessons. First, reducing variability raises throughput: a crew that reliably does what it said it would do is worth more to the project than a faster crew that is unpredictable. Second, the reliability of the hand-off between trades matters as much as the speed of each trade, because downstream trades can only work on what upstream trades release. Third, buffers between trades, in the form of extra work available or extra capacity, protect downstream trades from upstream variability, but they cost money in work in progress, space and longer duration. Lean planning tries to reduce variability first and then size buffers deliberately rather than letting them pile up by accident.
| Lesson | Site implication |
|---|---|
| Variability lowers system output | Reliable crews and reliable hand-offs matter more than peak speed |
| Losses propagate downstream | A late upstream trade costs every trade behind it |
| Buffers protect but cost | Work-in-progress buffers add space, damage risk and duration |
| The constraint sets the pace | Improving a non-constraint trade adds little throughput |
Sources of variability on site
Variability comes from two broad sources. Variability in the work itself includes differences between suites, unexpected conditions and the natural variation in how long tasks take. Variability in the readiness of work is usually much larger and more controllable: work that cannot start because the previous trade is not finished, material is not delivered, a drawing is not issued, an inspection has not happened or equipment is unavailable. The Last Planner System, covered in lessons 4 to 6, attacks this second source by making sure work is ready before it is assigned.
| Source | Example | Controllable? |
|---|---|---|
| Prerequisite work | Rough-in not finished before board | Largely, through make-ready planning |
| Materials | Late or wrong delivery | Largely, through procurement and pull |
| Information | Unanswered RFI, design change | Partly, through look-ahead and coordination |
| Labor | Crew size changes, absenteeism | Partly, through commitments and trade relationships |
| Equipment and space | Hoist booked, area congested | Largely, through logistics planning |
| Inspections and approvals | Inspector unavailable | Partly, through early booking |
| Weather | Rain, cold, wind | Partly, through protection and sequencing |
| Task duration | Natural variation, learning | Partly, through standard work and repetition |
Utilization and waiting
Queueing theory adds a second insight. When a resource such as a hoist, an inspector or a crane is busy most of the time, the queue waiting for it grows very quickly as its utilization approaches 100 %. The growth is not linear: going from 80 % to 90 % busy roughly doubles the waiting time, and going to 95 % doubles it again. A simple approximation for the average wait in a single-server queue with random arrivals and service times is the waiting time multiplied by u ÷ (1 − u), where u is utilization.
# Waiting time for the building hoist as utilization rises (M/M/1 approximation)
ts = 6.0   # average minutes per hoist trip
for u in (0.50, 0.70, 0.80, 0.90, 0.95):
    wq = u / (1 - u) * ts
print(f"utilization {u:.0%}: average wait {wq:5.1f} min per trip")utilization 50%: average wait 6.0 min per trip utilization 70%: average wait 14.0 min per trip utilization 80%: average wait 24.0 min per trip utilization 90%: average wait 54.0 min per trip utilization 95%: average wait 114.0 min per trip
The lesson for site logistics is that resources shared by many trades should not be planned at close to full utilization. A hoist that is busy 95 % of the time will produce long, unpredictable waits that ripple through every trade that depends on it. Lean sites schedule hoist and crane time, add capacity where it is the constraint and move material in planned windows so that queues stay short.
Push and pull
A push system releases work according to a schedule, regardless of whether the next step is ready. A traditional construction schedule pushes: the mechanical subcontractor mobilizes on the date in the master schedule, materials are shipped when the supplier's production allows, and drawings are issued when the designer's own schedule says. A pull system releases work only when the downstream step signals that it is ready. On a site, pull means that a trade starts an area when the previous trade has finished it and handed it over, that materials are delivered to match installation, and that design information is produced in the order the field will need it.
| Feature | Push | Pull |
|---|---|---|
| Trigger for work | Date in the schedule | Downstream readiness |
| Materials | Delivered when shipped | Delivered to match installation |
| Information | Issued on designer's schedule | Produced in the order the field needs |
| Work in progress | High and variable | Low and controlled |
| Response to delay | Work piles up in front of the late step | Upstream work slows to match |
Little's Law on a site
Little's Law, which BUS-230 lesson 3 introduced, says that average work in progress equals throughput multiplied by average time in the system. On a building, work in progress is the number of suites or zones that have been started but not finished, throughput is the rate at which they are finished and cycle time is how long each one takes from first trade to last. For a given throughput, more work in progress means longer cycle times. A site that starts many floors at once without finishing them ties up money, exposes partly finished work to damage and delays the point at which any suite can be handed over.
Worked problem
Work in progress and cycle time on Willowmere Residences
Northgate Builders finishes about 3 suites per week on Willowmere Residences. At present 36 suites are in progress, somewhere between framing and final clean. What is the average cycle time per suite? If lean planning reduces work in progress to 18 suites while keeping throughput at 3 per week, what happens to cycle time?
Show solution
- Cycle time = WIP ÷ throughput = 36 ÷ 3 = 12 weeks.
- With 18 suites in progress: 18 ÷ 3 = 6 weeks.
Answer: Average cycle time falls from 12 weeks to 6 weeks. Suites move from start to finish twice as fast, deficiencies are found sooner and the first floors can be handed over earlier, all without raising throughput.
Flow and the constraint
In any chain of dependent trades, one trade or resource has the least capacity and sets the pace for the whole: the constraint, or bottleneck. Goldratt's theory of constraints suggests five steps: identify the constraint, exploit it so it never loses time, subordinate everything else to its pace, elevate its capacity if needed and then look for the next constraint. On a building the constraint might be a trade with a small crew, a crane or hoist, an inspection or the supply of a key material. Making a non-constraint trade faster only creates more work in progress in front of the constraint. Takt planning, covered in lesson 7, takes a different but compatible approach: it sets a common pace for all trades and sizes each crew so that no one trade is a bottleneck.
Common mistakes
MistakeAssuming that if every trade averages a floor a week, the building will progress a floor a week.
InsteadRecognize that variability in dependent trades lowers system throughput below the average capacity.
MistakeValuing the fastest crew over the most reliable one.
InsteadReliability of output and hand-offs usually matters more than peak speed.
MistakePlanning a shared hoist or crane at nearly full utilization.
InsteadLeave spare capacity; waiting time grows sharply as utilization approaches 100 %.
MistakeStarting many floors at once to show progress.
InsteadLimit work in progress; by Little's Law it lengthens cycle time.
MistakeSpeeding up a trade that is not the constraint.
InsteadIdentify the constraint and improve or protect it first.
Summary and key terms
- Variability in dependent trades lowers the output of the whole system, because losses pass downstream and gains are capped.
- The parade of trades game shows that reducing variability raises throughput without changing average crew speed.
- Most site variability comes from work not being ready, which is largely controllable through planning.
- Waiting time for shared resources grows sharply as utilization approaches 100 %.
- Push releases work by schedule; pull releases it when the next step is ready.
- Little's Law links work in progress, throughput and cycle time; less WIP means faster cycle times.
- The constraint sets the pace; improving non-constraints adds little.
- Variability
- The spread in how long work takes or how much is produced from period to period.
- Dependent events
- Activities whose start depends on the completion of earlier activities.
- Parade of trades
- A simulation game showing how variability among sequential trades reduces throughput.
- Throughput
- The rate at which finished work leaves the system.
- Work in progress
- Work that has been started but not finished.
- Cycle time
- The time a unit of work spends from start to finish.
- Push system
- A system that releases work according to a schedule regardless of downstream readiness.
- Pull system
- A system that releases work only when the downstream step signals it is ready.
- Constraint
- The resource or step with the least capacity, which limits the whole system.
- Utilization
- The fraction of time a resource is busy.
Practice problems
Work each problem on paper first, then reveal the answer to check.
Why can't a downstream trade make up for an upstream trade's bad week?
Show answer
It can only work on what is available, and its spare capacity later may not coincide with available work.
In the parade of trades, what changes when dice are replaced by values of 3 or 4?
Show answer
Variability falls, so the last trade completes much more, though average capacity is the same.
A hoist trip averages 5 minutes and the hoist is 90 % busy. Estimate the average wait.
Show answer
0.9 ÷ 0.1 × 5 = 45 minutes.
Throughput is 4 suites per week and cycle time is 8 weeks. What is WIP?
Show answer
4 × 8 = 32 suites.
Give two controllable sources of variability.
Show answer
Any two of prerequisite work, materials, information, equipment, inspections.
What is the difference between push and pull?
Show answer
Push releases work by schedule; pull releases it when the next step is ready.
Why does high WIP delay handover?
Show answer
With the same throughput, more WIP means a longer cycle time, so suites take longer to finish.
What are Goldratt's five focusing steps?
Show answer
Identify, exploit, subordinate, elevate, repeat.
What do buffers cost?
Show answer
Space, money tied up in work in progress, damage risk and longer duration.
Why is reliability more valuable than speed in a chain of trades?
Show answer
Downstream trades depend on predictable hand-offs; unreliable output starves them.
Lesson quiz · 5 questions
Score 60% or more to complete this lesson.
Create a free account to save your progress, take quizzes and earn a certificate.