
CON-420 · Lesson 5 of 12 · 28 min
Delay II: schedule analysis methods
Once delays have been classified, someone has to show, with evidence, how much each one delayed completion. That is the job of schedule analysis, often called forensic schedule analysis when it is done after the fact for a claim or dispute. There is no single correct method. Different methods answer slightly different questions, need different records and can produce different results from the same facts, which is one reason why delay disputes are expensive. This lesson explains the main methods, works through a time impact analysis and a windows analysis on the Ashford schedule, and discusses how to choose a method and how decision-makers judge the result.
Guidance documents
Two documents are widely cited. The AACE International Recommended Practice 29R-03, Forensic Schedule Analysis, first published in 2007 and revised in 2011, classifies methods by whether they are observational or modeled, static or dynamic, and additive or subtractive, and gives practical guidance on each; AACE has since been working on a further revision, so check which edition is current before citing it. The Society of Construction Law Delay and Disruption Protocol, second edition 2017, published in the United Kingdom but read widely in Canada and elsewhere, recommends prospective time impact analysis for extensions of time during the project and discusses retrospective methods for disputes. Neither document is law, but tribunals often refer to them when judging whether an analysis was done properly.
| Method | Basic idea | Main records needed | Type |
|---|---|---|---|
| As-planned versus as-built | Compare the baseline with what happened and explain the differences | Baseline and as-built dates | Observational, static |
| Impacted as-planned | Insert delay events into the baseline and measure the effect on completion | Baseline and delay event details | Modeled, additive |
| Time impact analysis | Insert each event into the schedule update current at the time and measure its effect | Updated schedules and event fragnets | Modeled, additive, dynamic |
| Windows analysis | Divide the project into periods and measure the change in critical path and completion in each | Regular updates | Observational or modeled, dynamic |
| Collapsed as-built (but-for) | Remove delay events from the as-built schedule and see when the project would have finished | Detailed as-built schedule with logic | Modeled, subtractive |
As-planned versus as-built
The simplest method compares the baseline with the as-built dates, activity by activity, and explains each variance by reference to the records. Its strength is that it is easy to understand and does not depend on rescheduling software. Its weakness is that it says little about which delays were critical at the time, because the critical path changes as the project goes on. It works best on simple projects where the critical path stayed stable and the main delay is obvious.
Impacted as-planned
In an impacted as-planned analysis, the analyst takes the baseline schedule, adds a fragnet (a small network of activities representing the delay event) for each event claimed, and recalculates. The shift in completion is attributed to the events. The method is quick and needs only the baseline, which is why it is popular in claims prepared by one party. Its weakness is that it ignores what actually happened: it assumes the baseline was achievable and that nothing else changed. A contractor that was already running late for its own reasons can use an impacted as-planned analysis to blame the owner for delay the contractor itself caused. Tribunals are generally skeptical of impacted as-planned analyses for that reason, especially when prepared after the project.
Time impact analysis
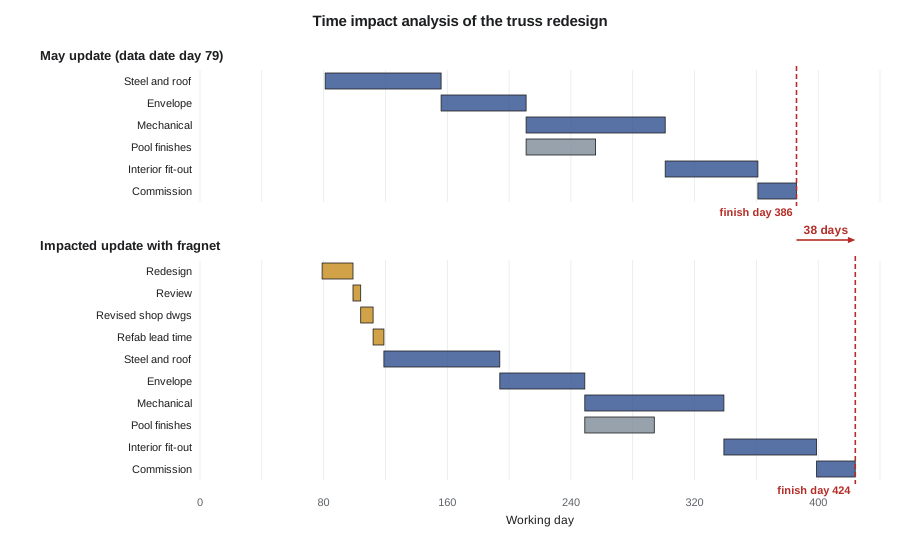
Time impact analysis (TIA) is an impacted analysis done on the right schedule: the update current when the event occurred, with progress to date. The analyst inserts the fragnet into that update, recalculates and measures the change in forecast completion. Because the update reflects actual progress up to that point, including any delays the contractor caused earlier, the TIA isolates the effect of the new event. Done prospectively, during the project, it is the recommended way to agree extensions of time as events happen. Done retrospectively, after the project, it is still useful but must be checked against what actually happened.
# Time impact analysis: insert the truss redesign fragnet into the May update (illustrative)
def cpm(acts, start_offsets):
    """Forward pass; start_offsets fixes actual starts for activities already begun."""
    EF = {}
    while len(EF) < len(acts):            # repeat until every activity is scheduled
        for a, (d, preds) in acts.items():
            if a not in EF and all(p in EF for p in preds):
                es = max([EF[p] for p in preds] + [start_offsets.get(a, 0)])
                EF[a] = es + d
    return EF

# May update: progress to date gives remaining durations; day 79 is the data date
update = {
    "Foundations rem":  (2, []),
    "Pool tanks rem":   (40, []),
    "Change room rem":  (48, []),
    "Steel and roof":   (75, ["Foundations rem"]),
    "Envelope":         (55, ["Steel and roof"]),
    "Mechanical":       (90, ["Change room rem", "Envelope"]),
    "Pool finishes":    (45, ["Pool tanks rem", "Envelope"]),
    "Interior fit-out": (60, ["Mechanical"]),
    "Commission":       (25, ["Interior fit-out", "Pool finishes"]),
}
data_date = 79
starts = {a: data_date for a in ("Foundations rem", "Pool tanks rem", "Change room rem")}
before = cpm(update, starts)["Commission"]

# Fragnet: redesign by consultant (20 days), review (5), revised shop drawings (8), refabrication lead (7)
impacted = dict(update)
impacted["Redesign"] = (20, [])
impacted["Review"] = (5, ["Redesign"])
impacted["Revised shop dwgs"] = (8, ["Review"])
impacted["Refab lead time"] = (7, ["Revised shop dwgs"])
impacted["Steel and roof"] = (75, ["Foundations rem", "Refab lead time"])
starts2 = dict(starts, **{"Redesign": data_date})
after = cpm(impacted, starts2)["Commission"]
print(f"Forecast completion before event: day {before}")
print(f"Forecast completion with fragnet: day {after}")
print(f"Time impact of truss redesign: {after - before} working days")Forecast completion before event: day 386 Forecast completion with fragnet: day 424 Time impact of truss redesign: 38 working days
The TIA shows that the redesign fragnet, 40 working days of consultant and shop drawing activity before the steel can be fabricated again, pushes forecast completion out by 38 working days, not 40, because the foundations still had two days of remaining work that the redesign path now absorbs in parallel. The result depends on the fragnet, so the fragnet must be built from the records: the date the problem was found, the consultant's actual or promised turnaround, the fabricator's stated lead time. A fragnet that uses inflated durations produces an inflated result and loses credibility. On Ashford, the prospective TIA forecast 38 working days, but the consultant later issued the redesign in 15 working days rather than the 20 it had promised, and the windows analysis below records 30 days of actual owner delay from the redesign. That is normal: a prospective analysis forecasts, and the retrospective record shows what actually happened.
Windows analysis
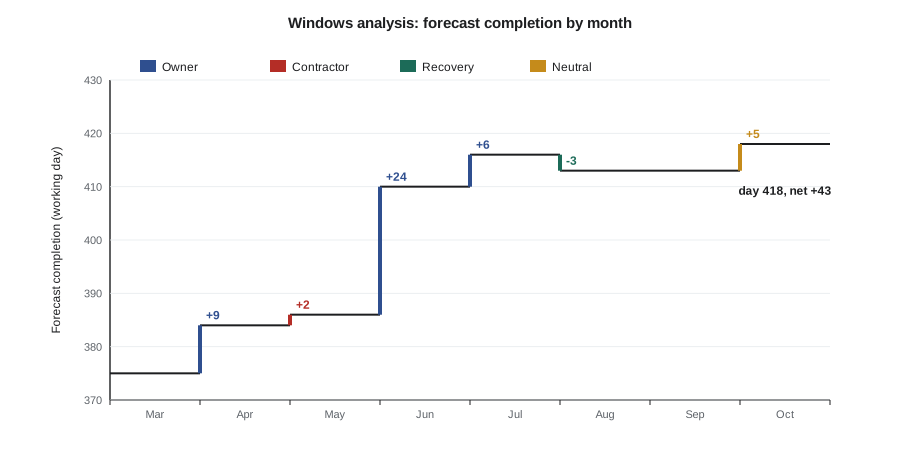
A windows analysis divides the project into periods, often matching the monthly updates, and examines each window in turn. For each window, the analyst compares the forecast completion at the start and at the end, identifies the critical path during the window and determines which events caused any change. The delay in each window is attributed to the responsible party, and the results are summed. Because it follows the project as it happened, using the contemporaneous updates, a windows analysis is often regarded as the most reliable retrospective method, provided the updates themselves are sound.
# Windows analysis from monthly updates on Ashford (illustrative forecast completion days)
windows = [  # month, forecast completion at end of window, critical driver, responsible party
    ("Mar", 375, "baseline", None),
    ("Apr", 384, "contaminated fill under leisure pool", "owner"),
    ("May", 386, "slow formwork crew on pool tanks", "contractor"),
    ("Jun", 410, "truss redesign", "owner"),
    ("Jul", 416, "truss redesign (crane down 10 days, not on critical path)", "owner"),
    ("Aug", 413, "recovery: resequenced envelope", "recovery"),
    ("Sep", 413, "no change", None),
    ("Oct", 418, "abnormal rain during roofing", "neutral"),
]
totals = {"owner": 0, "contractor": 0, "neutral": 0, "recovery": 0}
prev = windows[0][1]
for month, fc, driver, party in windows[1:]:
    change = fc - prev
    if party:
        totals[party] += change
    print(f"{month}: completion day {fc} ({change:+d})  {driver}")
    prev = fc
print("Net slip:", prev - windows[0][1], "working days")
for k, v in totals.items():
print(f" {k:<10} {v:+d}")Apr: completion day 384 (+9) contaminated fill under leisure pool May: completion day 386 (+2) slow formwork crew on pool tanks Jun: completion day 410 (+24) truss redesign Jul: completion day 416 (+6) truss redesign (crane down 10 days, not on critical path) Aug: completion day 413 (-3) recovery: resequenced envelope Sep: completion day 413 (+0) no change Oct: completion day 418 (+5) abnormal rain during roofing Net slip: 43 working days owner +39 contractor +2 neutral +5 recovery -3
The windows show how the forecast moved: 9 days of owner delay from the contaminated fill in April, 2 days of contractor delay from the formwork crew in May, 30 days of owner delay from the truss redesign in June and July, 3 days recovered in August by resequencing and 5 days of neutral delay from abnormal rain in October, for a net slip of 43 working days. Note how the July window records the crane breakdown as not on the critical path: when the analyst checked the update, there were no trusses ready to lift during the breakdown, so the crane was not driving completion. Whose credit the August recovery should go to is itself a question: if Kestrel Ridge resequenced at its own cost to mitigate the owner's delay, it may argue the recovery should reduce its own exposure rather than the owner's.
Collapsed as-built (but-for)
A collapsed as-built analysis starts from a detailed as-built schedule, with logic, and removes the delays caused by one party. The analyst then asks when the project would have finished 'but for' those delays. If removing the owner's delays shows that the project would still have finished late, the remaining lateness is the contractor's. The method uses what actually happened, which is a strength, but building a logic-linked as-built schedule after the fact requires judgment, and the analyst's choices about logic can drive the result. It is often used to test the other party's analysis rather than as the primary method.
Choosing a method
The choice depends on the records available, the contract's requirements, the purpose of the analysis and the forum. Many specifications require prospective time impact analyses for extension requests during the project. For a retrospective claim, the best method is usually the one the records support most strongly.
| Situation | Suitable methods |
|---|---|
| During the project, requesting an extension for a new event | Prospective time impact analysis on the current update |
| After the project, with good monthly updates | Windows analysis, supported by TIAs for major events |
| After the project, with a good baseline but poor updates | As-planned versus as-built, with care; possibly collapsed as-built |
| After the project, with detailed as-built records but no usable schedule | Collapsed as-built, or as-planned versus as-built |
| Testing the other party's analysis | Re-run their method with corrected inputs, or apply a different method as a cross-check |
Whatever the method, decision-makers look for the same qualities. Is the baseline reasonable and accepted? Were the updates accurate? Are the fragnets based on the records? Does the analysis account for all delays, including the claimant's own? Does the result agree with what the people on site said at the time? An analysis that blames every day on the other party, and none on the claimant, is rarely believed. Experts who concede the claimant's own delays usually have more credibility on the rest.
US tribunals, including the federal Boards of Contract Appeals, generally expect an analysis that identifies the critical path contemporaneously, often favoring windows or contemporaneous period analysis over impacted as-planned methods, and they require the claimant to separate its own delays from the government's. Expert testimony must meet Federal Rule of Evidence 702 in federal courts, as amended in December 2023, which lesson 11 discusses.
Common manipulations to watch for
Schedule analysis can be manipulated, deliberately or not. Reviewers on both sides should check for changes to logic or durations between the baseline and the analysis without explanation, constraints that force a desired result, fragnets with durations longer than the records support, removal of the claimant's own delays from the as-built schedule, and selective choice of windows that hide recoveries or contractor delays. Comparing the native schedule files, not just printouts, is the only reliable way to find these problems.
| Red flag | What to check |
|---|---|
| Completion moves more than the fragnet duration | Logic changes, added constraints, calendar changes |
| No contractor delay anywhere in the analysis | Daily reports and updates for slow progress, rework, resource shortages |
| Fragnet durations longer than correspondence shows | Dates of RFIs, responses, shop drawing submissions and approvals |
| Critical path jumps between unrelated activities | Whether the path is realistic or a product of missing logic |
| Windows of uneven length or odd boundaries | Whether boundaries were chosen to isolate favorable results |
Worked problem
Checking the crane breakdown
The city's consultant argues that the crane breakdown from working day 12 to day 22 of the redesign period was concurrent with the truss delay, so Kestrel Ridge should get time but no money for those 10 days. How should Kestrel Ridge test this?
Show solution
- Look at the July update and daily reports: what was the crane scheduled to lift during the breakdown?
- Check the fragnet: revised truss shop drawings were not approved until redesign day 33, and refabrication took a further 7 days.
- If no trusses were available to lift during the breakdown, the crane was not on the critical path; at most it delayed non-critical lifts such as mechanical units for the change room block.
- Check whether those non-critical lifts had float that absorbed the breakdown.
Answer: If the records show no trusses were ready during the breakdown and the change room lifts had float, the breakdown was not concurrent with the truss delay, and Kestrel Ridge is entitled to time and money for the full redesign period. If instead the crane was needed for critical lifts, the concurrency argument has force.
Common mistakes
MistakeRelying on an impacted as-planned analysis prepared after the project.
InsteadUse the contemporaneous updates through a TIA or windows analysis where they exist.
MistakeUsing fragnet durations that the records do not support.
InsteadBuild fragnets from dated correspondence and supplier commitments.
MistakeLeaving the claimant's own delays out of the analysis.
InsteadAccount for all delays; credibility depends on it.
MistakeReviewing printouts instead of native schedule files.
InsteadCompare native files to find logic, duration and constraint changes.
MistakeTreating the method as the answer.
InsteadCross-check the result against the records and site testimony.
Summary and key terms
- Schedule analysis measures how much each event delayed completion; there is no single correct method.
- AACE RP 29R-03 and the SCL Delay and Disruption Protocol are widely cited guidance, not law.
- Impacted as-planned analysis is quick but ignores what actually happened; tribunals are often skeptical of it.
- Time impact analysis inserts each event into the update current at the time; done prospectively, it is the recommended way to agree extensions.
- Windows analysis follows the contemporaneous updates period by period and is often the most reliable retrospective method.
- Collapsed as-built analysis removes one party's delays from the as-built schedule to test 'but for' completion.
- Credible analyses use sound records, account for all parties' delays and agree with what happened on site.
- Forensic schedule analysis
- Analysis of schedules and records to determine the causes and extent of delay.
- Fragnet
- A fragment of network representing a delay event, inserted into a schedule.
- Impacted as-planned
- A method that inserts delay events into the baseline schedule.
- Time impact analysis
- A method that inserts a delay event into the schedule update current when it occurred.
- Windows analysis
- A method that examines the change in completion and critical path in successive periods.
- Collapsed as-built
- A method that removes delays from the as-built schedule to find but-for completion.
- Data date
- The date up to which progress is recorded in a schedule update.
- As-built schedule
- A record of the actual start and finish dates of activities.
- Prospective analysis
- Analysis done during the project to forecast the effect of an event.
- Retrospective analysis
- Analysis done after the event to determine what actually caused delay.
Practice problems
Work each problem on paper first, then reveal the answer to check.
What is a fragnet?
Show answer
A small network of activities representing a delay event, inserted into a schedule.
Why are tribunals skeptical of impacted as-planned analyses?
Show answer
They ignore actual progress and other delays, so they can blame the other party for the claimant's own delay.
Which schedule does a time impact analysis use?
Show answer
The update current when the event occurred.
A window starts with forecast completion day 390 and ends at day 402, all due to owner delay. How much owner delay is attributed?
Show answer
12 working days.
What does a collapsed as-built analysis ask?
Show answer
When the project would have finished but for one party's delays.
Which method does the SCL Protocol recommend for extensions during the project?
Show answer
Prospective time impact analysis.
Name two red flags in a delay analysis.
Show answer
For example, fragnet durations longer than the records, or no claimant delay anywhere.
Why compare native schedule files rather than printouts?
Show answer
To detect changes in logic, durations, constraints and calendars.
In the Ashford TIA, why was the impact 38 days rather than 40?
Show answer
Two days of remaining foundation work ran in parallel with the redesign path.
What should an analyst do with a recovery period in a windows analysis?
Show answer
Record it and decide, based on who paid for it, whose delay it offsets.
Lesson quiz · 5 questions
Score 60% or more to complete this lesson.
Create a free account to save your progress, take quizzes and earn a certificate.