
CRE-230 · Lesson 8 of 12 · 27 min
Carousels, infographics and data graphics
Carousels, multi-image posts that viewers swipe through, and infographics, graphics that explain information visually, are among the most saved and shared formats on Instagram, LinkedIn and other platforms. They let creators teach, tell stories and present data in a format people can absorb at their own pace and return to later. CRE-120 covered writing for carousels. This lesson covers their visual design: the structure of a carousel, cover slides, designing inner slides for continuity and swiping, information design principles, charts and data visualization, avoiding misleading graphics, step-by-step and comparison graphics, PDF documents on LinkedIn, and exporting multi-page content.
The structure of a carousel
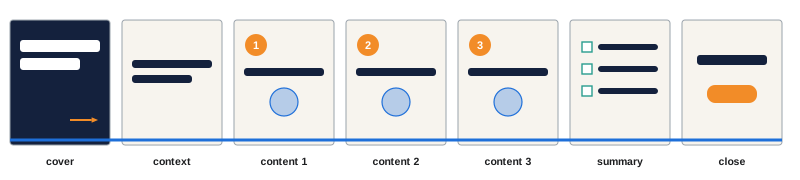
A carousel works like a short visual story or lesson. A common structure is:
- Cover slide: a strong hook that promises value and makes people swipe.
- Context slide: why the topic matters or what problem it solves.
- Content slides: one idea per slide, building logically, such as steps, tips, examples or comparisons.
- Summary or payoff slide: the key takeaway, result or checklist.
- Closing slide: a call to action, such as save, share, follow or comment, and credit or sources.
Platforms limit the number of slides, with Instagram allowing up to 20 images or videos per carousel at the time of writing, but most effective carousels use far fewer, often 6 to 10. Each slide should be quick to read: a headline and a few short lines, or one image with a caption. If a slide needs a paragraph, split it.
Cover slides
The cover slide determines whether anyone sees the rest. It needs a large, specific headline that promises a clear benefit, such as "7 budget meals under $5" or "How I organize 10,000 photos", a supporting image or illustration, and a visual cue that there is more to see, such as an arrow, "swipe" text, a partially visible element continuing off the edge, or a numbered series. The cover should look distinctive in the feed and in the profile grid, which may crop it to 3:4. Some creators also design the second slide as a second hook, because platforms may show it to people who scrolled past the first.
Designing inner slides
Inner slides should feel like pages of the same document. Keep a consistent grid, margins, typeface, color scheme and positions for headings, body text, page numbers and logos. Number slides when the content is sequential, to show progress. Use visual continuity, such as a line, shape or illustration that runs across slide boundaries, to encourage swiping; when viewers see half of an element cut off at the edge, they swipe to complete it. Vary layouts within the system to keep interest, alternating text-heavy and image-heavy slides. Leave enough margin that platform interface elements, such as the slide indicator dots and buttons, do not cover content.
Worked problem
Designing a seamless panorama carousel
A travel creator wants a continuous panorama across 3 slides at 1080 × 1350 each, so that the image flows as viewers swipe. What dimensions should the panorama be designed at, and how is it split?
Show solution
- Total width: 3 × 1080 = 3240 pixels; height 1350 pixels.
- Design the full panorama at 3240 × 1350, placing key subjects away from the cut lines at 1080 and 2160 pixels.
- Slice it into three 1080 × 1350 images exactly, without gaps or overlaps.
- Keep text and faces at least 80 pixels away from each cut line so nothing important is split.
Answer: Design at 3240 × 1350 and slice into three 1080-pixel-wide images, keeping key elements clear of the 1080 and 2160 cut lines.
Information design principles
Information design makes complex information easy to understand. Key principles include:
- Start with the message: decide the single most important point before choosing a visual form.
- Chunk information: break it into small, digestible groups, such as steps, categories or time periods.
- Use visual encoding deliberately: position, length, size, color and shape each carry meaning; use them consistently.
- Label directly: put labels next to the elements they describe rather than in separate legends where possible.
- Reduce clutter: remove unnecessary gridlines, borders, decorations and three-dimensional effects.
- Show sources: cite where data comes from, and the date, in small but readable text.
Good infographics often combine a headline that states the conclusion, a simple chart or diagram, and short annotations that explain what matters.
Choosing charts
Different questions call for different charts:
| Question | Suitable chart | Notes |
|---|---|---|
| How do amounts compare? | Bar chart | Start bars at zero; sort by value |
| How does something change over time? | Line chart | Consistent time intervals |
| What are the parts of a whole? | Stacked bar or simple pie (few parts) | Avoid pies with many slices |
| How are two measures related? | Scatter plot | Label notable points |
| How are values distributed? | Histogram | Choose sensible bin widths |
| How do categories rank? | Sorted bar chart | Horizontal bars suit long labels |
| What is a single key number? | Large number with context | Compare to a baseline |
On small screens, simple charts work best: few categories, large labels, one highlight color for the key data and neutral colors for the rest. Horizontal bar charts fit long category labels in narrow formats. A single big number with a short explanation, such as "73 % of respondents...", is often more effective than a complex chart.
Avoiding misleading graphics
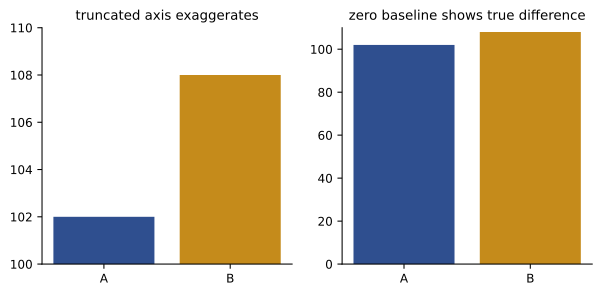
Charts can mislead even when the numbers are correct. Common problems include bar charts with axes that do not start at zero, exaggerating differences; inconsistent time intervals on line charts; three-dimensional effects that distort size; pictograms scaled by height so their area exaggerates differences; cherry-picked time ranges; percentages without base numbers; and dual axes that suggest false relationships. Edward Tufte described a "lie factor", the ratio of the size of an effect shown in the graphic to the size of the effect in the data; a value far from 1 signals distortion. Misleading graphics damage credibility when spotted, and in advertising or financial contexts may breach consumer protection rules. Design to inform, not to manipulate.
Steps, comparisons and checklists
Several information formats recur in creator content. Step-by-step graphics number each step clearly, use consistent icons or photos, and progress in reading order. Comparison graphics place options side by side in columns, with matched rows and clear highlighting of differences; before-and-after graphics use split layouts with consistent framing so the difference is honest. Checklists and cheat sheets use generous spacing, checkboxes or bullet icons, and grouping into categories, and are particularly likely to be saved. Timelines show events along a line with consistent spacing for equal time intervals, or explicitly mark breaks when they do not.
Document posts and PDFs
LinkedIn supports document posts, multi-page PDFs that display as swipeable slides in the feed, widely used for professional carousels, guides and reports. Design them at a consistent page size, commonly square (1080 × 1080) or portrait (1080 × 1350), export as PDF with fonts embedded, keep file sizes reasonable, and add a document title, since LinkedIn displays it. Text in PDFs can be selectable, which helps accessibility, but slides should still be designed for quick reading on phones. Free downloadable guides and lead magnets for email lists (CRE-301) follow similar design principles, with more detail and a print-friendly option.
Exporting multi-page content
Export carousels as individual images at the exact pixel dimensions, numbered in order (for example, "topic-01.png" to "topic-08.png"), in sRGB, as PNG for graphics with text or high-quality JPEG for photographic slides. Check the first and last slides in the platform's preview before posting, and write alt text for each slide describing its content (Lesson 11). Keep the editable design file so that the carousel can be updated or repurposed, for example into a PDF, a blog post or a short video.
Writing for slides
Carousel text works best in short, parallel phrases. Each slide's headline can be a complete idea, such as "Batch your errands", supported by one or two short lines explaining how or why. Parallel structure, starting each tip with a verb or using the same pattern, makes slides easier to scan. Numbers help viewers track progress and remember content. Keep consistent terminology across slides, and avoid ending slides mid-sentence unless deliberately creating a cliffhanger that encourages swiping. CRE-120 covers carousel writing in detail; the design goal is to give each slide's text room to breathe at a readable size.
Diagrams and flowcharts
Some ideas are best shown as diagrams: processes as flowcharts, relationships as networks, hierarchies as trees, overlapping categories as Venn diagrams, cycles as circular arrows, and spatial information as maps. Keep diagrams simple on small screens: a few boxes, large labels, clear arrows, and consistent shapes for consistent meanings, such as rounded boxes for steps and diamonds for decisions. Arrows should flow in the reading direction, usually left to right or top to bottom. Where a diagram becomes complex, split it across slides, revealing one part at a time, which also encourages swiping.
Worked problem
Splitting a dense infographic
A creator has an infographic with 12 statistics about sleep, arranged in a grid on one 1080 × 1350 graphic. At phone size the numbers are tiny. How could it be redesigned?
Show solution
- Group the 12 statistics into four themes of three statistics each.
- Create a cover slide with the most surprising statistic as the hook.
- Use one slide per theme, with three large numbers and short labels each.
- Finish with a summary slide of the three key takeaways and a source slide listing references.
Answer: Turn it into a six-slide carousel: a hook cover, four themed slides with three statistics each, and a summary and sources slide.
Citing sources visually
Information graphics are more credible when they show sources. Place a short source line, such as "Source: Statistics Canada, 2025", in small but readable text at the bottom of the slide, and put full citations in the caption or on a final slide. Use reputable, current sources, check that numbers are quoted accurately and in context, and note when figures are estimates or from surveys with particular samples. When data comes from your own analytics or experience, say so.
Templates for carousels
Because carousels have many slides with similar structure, they benefit most from templates (Lesson 9). A carousel template set might include two cover layouts, three inner layouts (text only, image with text, and data), a quote slide, a summary checklist and a closing slide, all sharing margins, typefaces, colors and page number positions. With these, a new carousel becomes a matter of writing the content and choosing layouts.
Saving and sharing behavior
Carousels and infographics are often saved for later reference, which signals value to platforms and to the creator. Designs that encourage saving include checklists, cheat sheets, step-by-step guides, templates and reference tables. A closing slide that summarizes the content, so the saved post is useful on its own, and a gentle prompt to save or share it, can increase these actions without feeling pushy. Shareable slides, ones that make sense out of context, also travel well when people screenshot and send them to friends.
Quality control for carousels
Before posting, check every slide: spelling and numbers, consistent alignment and margins, slide order, page numbers, contrast, alt text for each image, and the preview of the first slide in the grid crop. Swiping through the carousel on a phone, as a viewer would, catches problems that are invisible in the design tool, such as text too close to the slide indicator dots.
Comparison tables on small screens
Tables are useful for comparisons but need care on phones. Limit them to about three columns and five or six rows, use large text, alternate row shading for readability, align numbers to the right and text to the left, and highlight the recommended option or key cell with the accent color. If a table needs more rows or columns, split it across slides, or convert it into a series of cards, one per option, each showing the same attributes in the same order. Always include a header row, and avoid tiny footnotes; put caveats in the caption instead.
Common mistakes
MistakeParagraphs of text on carousel slides.
InsteadOne idea per slide in short lines.
MistakeA weak cover slide.
InsteadA specific, benefit-driven hook with a swipe cue.
MistakeInconsistent layouts between slides.
InsteadUse one grid, style and fixed positions.
MistakeBar charts with truncated axes.
InsteadStart bars at zero and avoid distortion.
MistakeComplex charts on small screens.
InsteadSimplify, highlight one series, label directly.
Summary and key terms
- Carousels follow a structure: cover, context, content, summary and close.
- Covers need a specific benefit, a strong image and a swipe cue.
- Inner slides share a grid and style, with continuity to encourage swiping.
- Information design starts with the message, chunks content and labels directly.
- Choose charts by question, simplify for phones and cite sources.
- Avoid misleading axes, 3D effects and distorted pictograms.
- Design document posts and export numbered, accessible slides.
- Carousel
- Multi-image post viewers swipe through.
- Cover slide
- First slide that hooks viewers.
- Visual continuity
- Elements linking slides across boundaries.
- Infographic
- Graphic explaining information visually.
- Chunking
- Breaking information into small groups.
- Direct labeling
- Placing labels next to chart elements.
- Lie factor
- Tufte's ratio of shown effect to data effect.
- Truncated axis
- Axis that does not start at zero.
- Document post
- Multi-page PDF shown as slides on LinkedIn.
- Lead magnet
- Free resource offered for an email sign-up.
Practice problems
Work each problem on paper first, then reveal the answer to check.
List the five parts of a carousel structure.
Show answer
Cover, context, content, summary, close.
How many slides do effective carousels often use?
Show answer
About 6–10.
Name two swipe cues.
Show answer
Arrow, swipe text, element cut off at the edge, numbering.
Panorama width for 4 slides of 1080 px?
Show answer
4320 px.
Which chart suits change over time?
Show answer
Line chart.
Why avoid pies with many slices?
Show answer
They are hard to compare.
What is direct labeling?
Show answer
Labels placed beside elements.
Lie factor if a 10 % change is drawn as 40 %?
Show answer
4.
What is a LinkedIn document post?
Show answer
A PDF shown as swipeable slides.
How should carousel files be named?
Show answer
Numbered in order, e.g. topic-01.png.
Lesson quiz · 5 questions
Score 60% or more to complete this lesson.
Create a free account to save your progress, take quizzes and earn a certificate.