
CRE-310 · Lesson 4 of 12 · 29 min
Media kits and audience data
A media kit is a creator's sales document: a short, well-designed summary of who you are, who your audience is, how your content performs and what you offer brands. It answers the questions a brand manager asks when deciding whether to contact you, and it saves both sides time. This lesson covers what goes into a media kit, how to calculate and present the key metrics honestly, how to handle audience data responsibly and how to keep the kit current.
What a media kit is for
Brand managers and agency staff review many creators quickly. A media kit lets them assess fit in a minute or two without digging through your analytics. It also signals professionalism: a clear, accurate, up-to-date kit suggests a creator who will be easy to work with. Media kits are usually one to three pages as a PDF or a simple web page, and are sent with pitches or on request.
A media kit is not the same as a rate card, although many creators include one or attach it separately. Some creators prefer to leave prices out of the kit and discuss them once they understand a brand's needs; others include starting prices to filter out brands with very small budgets. Both approaches are reasonable, and Lesson 5 discusses pricing in depth.
The essential sections
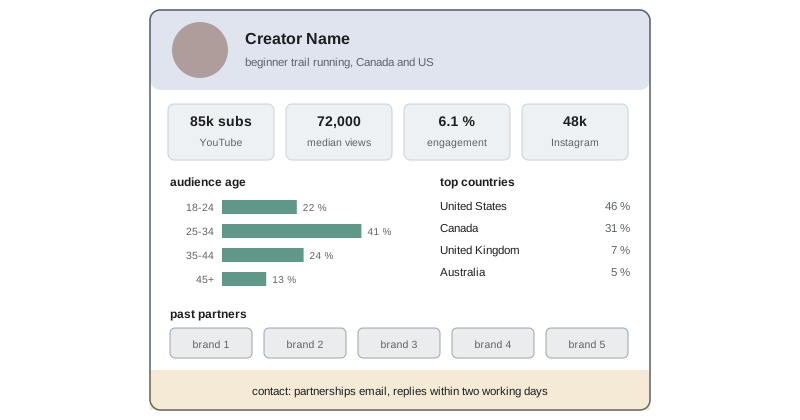
Most effective media kits include the following, in roughly this order:
- A short introduction: your name, a photo, one or two sentences describing your content and positioning.
- Platforms and audience size: followers or subscribers on each platform that matters for partnerships.
- Performance metrics: typical views or reach per post, engagement rate, and for some formats watch time, saves or clicks.
- Audience demographics: age ranges, gender split, top countries and cities, and relevant interests.
- Past partners and results: logos or names of brands you have worked with, with short case studies and results where you have permission to share them.
- Offerings: the types of partnership you offer, such as integrations, dedicated videos, short-form bundles, UGC, usage rights, events or ambassadorships.
- Testimonials: short quotes from past brand partners, with permission.
- Contact details: an email address or a manager's contact, and how quickly you respond.
Choosing honest, meaningful metrics
The metrics in your kit should help a brand predict what a partnership will deliver. Follower counts are the most visible number, but they are a weak predictor of results: many followers may be inactive, and algorithms show posts to non-followers too. Brands increasingly focus on typical views or reach per post and on engagement.
Use medians or averages over a recent period, such as the last 30 or 90 days or the last 10 to 20 comparable posts. Medians are less distorted by a single viral post than means, so they give a more honest picture of what a brand can expect. State the period and the method in small print: "median views per video, last 15 videos, as of September" builds credibility.
Engagement rate can be calculated in several ways: by followers, by reach, by impressions or by views. The definition changes the result considerably, so always state which one you use. Engagement by reach or by views is generally more meaningful than by followers, because it measures how people who actually saw the content responded. Some brands also value particular actions more than others: a save or a share usually signals stronger interest than a like.
Worked problem
Calculating engagement rates
A creator's last 10 posts had a total of 18,000 likes, 900 comments, 1,100 shares and 2,000 saves. Total reach was 400,000, and the creator has 120,000 followers. Calculate the average engagement rate per post by reach and by followers.
Show solution
- Total engagements: 18,000 + 900 + 1,100 + 2,000 = 22,000.
- By reach: 22,000 ÷ 400,000 = 5.5 %.
- Average engagements per post: 2,200; by followers: 2,200 ÷ 120,000 ≈ 1.8 %.
Answer: About 5.5 % by reach and about 1.8 % per post by followers; the kit should state which definition is used.
Benchmarks vary by platform, tier and niche. Industry reports commonly show average engagement rates by followers in the low single digits on Instagram and higher on TikTok, with smaller accounts typically achieving higher rates than large ones. Compare yourself with creators of similar size on the same platform rather than with a general average, and remember that brands will often check your public numbers themselves.
Audience demographics
Brands need to know whether your audience matches their customers. Platform analytics provide age ranges, gender splits and top countries and cities. Include the figures that matter for partnerships: the share of your audience in the countries where the brand sells, the main age groups, and any interest data available. If your audience is concentrated in Canada and the United States, say so prominently, because many brands ship only within those countries.
| Metric | Where it comes from | Why brands care |
|---|---|---|
| Median views per post | Platform analytics, recent posts | Predicts reach of sponsored content |
| Engagement rate (stated basis) | Calculated from analytics | Indicates audience attention and trust |
| Top countries and cities | Platform analytics | Shows whether the audience can buy |
| Age and gender split | Platform analytics | Matches the brand's target customer |
| Click-through and conversion history | Past campaign reports, link tools | Predicts sales for performance campaigns |
| Watch time and retention | Video analytics | Shows whether sponsored segments are seen |
Supplement numbers with qualitative insight. What do your audience members care about? What questions do they ask most? What have they bought on your recommendation? A sentence such as "my comments are full of beginners asking which equipment to buy first" tells a gear brand more than a percentage.
Worked problem
Estimating relevant reach
A creator's videos receive a median of 80,000 views. Analytics show 45 % of viewers in the United States, 12 % in Canada and the rest elsewhere. A brand ships only to Canada. How many relevant views can it expect per video, and what is the effective CPM if it pays $1,600?
Show solution
- Relevant views: 80,000 × 0.12 = 9,600.
- Effective CPM on relevant views: $1,600 ÷ 9.6 ≈ $167.
- The fee looks expensive for a Canada-only brand; a brand shipping to both countries gets 80,000 × 0.57 = 45,600 relevant views, an effective CPM of about $35.
Answer: About 9,600 relevant views and an effective CPM near $167 for the Canada-only brand, which explains why location data matters.
Sharing data responsibly
Media kits should present aggregate audience data, not information about individuals. Platform analytics are already aggregated, but be careful with data from other sources such as email lists, community platforms or surveys. Do not share subscriber lists, email addresses or identifiable information with brands unless people have clearly consented and the law permits it.
In the United States there is no single general privacy law, but state laws such as the California Consumer Privacy Act (as amended by the CPRA) and similar laws in many other states regulate the sale and sharing of personal information above certain thresholds, and the FTC can act against unfair or deceptive data practices. Share only aggregated statistics in a media kit.
Brands sometimes ask for screenshots of analytics or temporary access to analytics through an influencer platform. Screenshots of aggregate data are normal. Granting account access is riskier; if you do it, use official read-only connections provided by the platform or reputable software, never share your password, and revoke access when the campaign ends.
Case studies and social proof
Results from past partnerships are among the most persuasive elements of a media kit. A short case study names the brand (with permission), the objective, what you made and the outcome: "Spring launch for a running shoe brand: one integration and three short videos; 210,000 views, 4,800 link clicks, 310 code redemptions; renewed for autumn." If you have no paid partnerships yet, include examples of organic product content that performed well, or results from gifted collaborations.
Always check permission before naming brands or sharing campaign results; some contracts include confidentiality clauses that prohibit it. Where you cannot name the brand, describe it generically, such as "a national meal-kit brand".
Design and format
A media kit should look professional and consistent with your content style, but it does not need to be elaborate. Readability matters more than decoration. Use a clean layout, large clear numbers, a small number of colors, high-quality photos and plenty of white space. Make sure it reads well on a phone, because many brand managers open attachments on mobile. Keep the file size small, name the file clearly (for example "YourName-MediaKit-2026.pdf"), and consider a web version with a link that never changes, so brands always see the current numbers.
Keeping it current
Out-of-date numbers damage credibility, especially if a brand checks your public profile and finds different figures. Update your media kit at least quarterly, and immediately after a significant change such as a big jump in audience or a notable campaign result. Include an "as of" date on the kit so brands know how recent the data is. A simple spreadsheet that tracks your key metrics monthly makes updates quick.
Worked problem
Tracking growth for the kit
A creator's median views per video were 42,000 in the first quarter and 51,000 in the second. What was the percentage growth, and how should the kit present it?
Show solution
- Growth: (51,000 − 42,000) ÷ 42,000 ≈ 0.214, or about 21 %.
- Present the current median (51,000) as the headline figure, dated.
- Optionally add the trend: "median views up 21 % quarter on quarter".
Answer: About 21 % growth; show the current dated median and mention the trend as supporting evidence.
Common integrity problems
Inflating numbers in a media kit is tempting but self-defeating. Brands and agencies routinely check public metrics, use software to estimate audience quality, and compare campaign results with the kit. Discrepancies end relationships and can lead to disputes over payment. Present your best honest picture: choose the most relevant metrics, explain them clearly and let real results speak.
Platform-specific metrics
Different platforms emphasize different metrics, and your kit should present the ones brands expect for each. For YouTube, brands often look at median views in the first 30 days, average view duration and audience retention, because these predict how many people will see a mid-roll integration. For Instagram, reach, story views and saves are central, as are profile visits and link clicks from stories. For TikTok, views, completion rate and shares matter most because distribution depends heavily on the recommendation algorithm rather than followers. For podcasts, downloads per episode within 30 days are the standard measure. For newsletters, open rates and click rates are key, although open rates have become less reliable since privacy changes on some email apps.
Tools for audience data
Native platform analytics are the most trusted source of audience data, because they come directly from the platform. Third-party influencer tools estimate audience demographics and authenticity from public data, and brands often use them to check creators. Their estimates are not always accurate, so it is wise to check what these tools show about your accounts and be ready to provide screenshots of native analytics if a brand's tool gives a misleading picture.
A web-based kit
Many creators now keep a simple web page as their media kit, linked from their profiles and pitch emails. A web version can be updated in minutes, can include embedded examples of past sponsored content and can track how often brands view it. If you use one, keep a downloadable PDF version too, because some brands need a file to share internally or attach to approval documents.
Finally, ask a trusted peer to review your kit before sending it. A fresh reader quickly spots unclear metrics, missing context or claims that look exaggerated.
Common mistakes
MistakeLeading with follower count alone.
InsteadLead with median views, engagement and audience fit.
MistakeUsing a viral post as the typical result.
InsteadUse medians over a stated recent period.
MistakeNot stating how engagement rate was calculated.
InsteadState the basis: reach, views or followers.
MistakeSharing subscriber details with brands.
InsteadShare only aggregated audience data.
MistakeLetting the kit go stale.
InsteadUpdate quarterly and date the figures.
Summary and key terms
- A media kit summarizes who you are, your audience, your performance and your offers.
- Lead with median views, engagement and demographics rather than followers alone.
- Engagement rate depends on its basis; always state it.
- Location data determines how many views are relevant to a brand.
- Share aggregated data only and follow privacy law for subscriber information.
- Case studies and testimonials, with permission, are powerful social proof.
- Keep the kit honest, readable, mobile friendly and dated.
- Media kit
- A creator's summary document for brands.
- Rate card
- A list of a creator's standard prices.
- Engagement rate
- Engagements as a percentage of reach, views or followers.
- Reach
- The number of unique accounts that saw content.
- Impressions
- The total number of times content was displayed.
- Median
- The middle value, less distorted by outliers.
- Relevant views
- Views from people the brand can actually sell to.
- Case study
- A short account of a past partnership and its results.
- Social proof
- Evidence from others that builds credibility.
- Aggregate data
- Statistics that do not identify individuals.
Practice problems
Work each problem on paper first, then reveal the answer to check.
Name five sections of a media kit.
Show answer
Intro, platforms, performance, demographics, partners, offerings, contact.
Why use medians rather than means?
Show answer
Medians resist distortion from viral outliers.
Engagement rate for 3,000 engagements on 60,000 reach?
Show answer
5 %.
Relevant views from 50,000 views with 30 % in the target country?
Show answer
15,000.
Why include an "as of" date?
Show answer
It shows how current the numbers are.
What should you never share in a media kit?
Show answer
Personal information about individual followers.
What makes a good case study?
Show answer
Brand, objective, deliverables and results, with permission.
Growth from 20,000 to 25,000 median views?
Show answer
25 %.
How often should a media kit be updated?
Show answer
At least quarterly.
Safest way to give a brand analytics access?
Show answer
Screenshots or official read-only connections, never passwords.
Lesson quiz · 5 questions
Score 60% or more to complete this lesson.
Create a free account to save your progress, take quizzes and earn a certificate.