
MATH-201 · Lesson 12 of 12 · 28 min
Modeling case studies and course project
The previous eleven lessons built a toolkit: first-order methods and phase lines, linear equations of every order, oscillators, boundary value and eigenvalue problems, Laplace transforms and transfer functions, linear and nonlinear systems, and partial differential equations. In practice, an engineer is rarely told which tool to use. The work starts with a physical situation and a question, and the skill lies in turning that into a model, choosing a method, checking the answer and deciding what it means. This lesson works through three case studies that each draw on several lessons: protecting a building from earthquake shaking, preventing thermal runaway in a battery cell, and finding how deep to bury a water main so that it does not freeze. It then sets out the course project and looks ahead to the courses that build on this one.
Case study 1: base isolation of a building
In an earthquake, the ground moves and the building is shaken from below. If the dominant ground frequency is close to a natural frequency of the building, the response is amplified, as Lesson 5 showed for forced vibration. Base isolation places flexible bearings (laminated rubber or sliding pendulum bearings) between the building and its foundation, making the whole structure behave like a single mass on a soft, damped spring with a long natural period.
Model the building as a rigid mass m on isolators of stiffness k and damping c. With ground displacement \(y = Y\sin\omega t\) and building displacement x, Newton's law gives \(m\ddot{x} + c(\dot{x} - \dot{y}) + k(x - y) = 0\). The transfer function from ground to building, evaluated at \(s = i\omega\) (Lesson 8), gives the transmissibility, the ratio of building to ground motion amplitudes:
Worked problem
Is isolation worth it?
A low-rise hospital has a fixed-base natural period of 0.5 s with 5% damping. The expected ground shaking is dominated by 2 Hz. Isolation would lengthen the period to 2.5 s with 15% damping. Compare the motion transmitted, and the isolator displacement.
Show solution
- Fixed base: \(f_n = 2\) Hz, so \(r = 1\) and \(TR = \sqrt{1 + 0.01}/\sqrt{0 + 0.01} = 10.0\).
- Isolated: \(f_n = 0.4\) Hz, so \(r = 5\) and \(2\zeta r = 1.5\): \(TR = \sqrt{3.25}/\sqrt{576 + 2.25} = 0.075\).
- The relative displacement across the isolators has amplitude \(Y r^2/\sqrt{(1 - r^2)^2 + (2\zeta r)^2} = 25Y/24.05 = 1.04Y\).
Answer: The fixed-base building amplifies the ground motion tenfold; the isolated one receives 7.5% of it, more than a hundred times less. The price is that the isolators must deform by about the full ground displacement, so the building needs a moat around it and flexible utility connections. The damping trade-off is visible in the formula: more damping limits motion near resonance but slightly worsens isolation at high frequency.
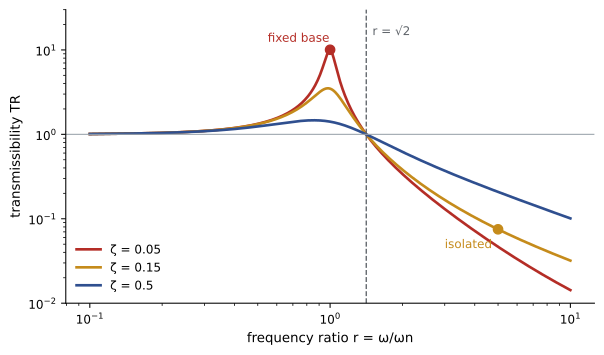
The model uses Lessons 5 and 8, and a real design adds the multi-story modes of Lesson 9 and a time-history analysis using Duhamel's integral (Lesson 4) or numerical integration with recorded ground motions. Isolated hospitals and emergency centers have stayed in operation through major earthquakes in the United States and Japan, and the technique is increasingly used for critical buildings and heritage retrofits in high-hazard regions, including coastal British Columbia.
Case study 2: thermal runaway in a battery cell
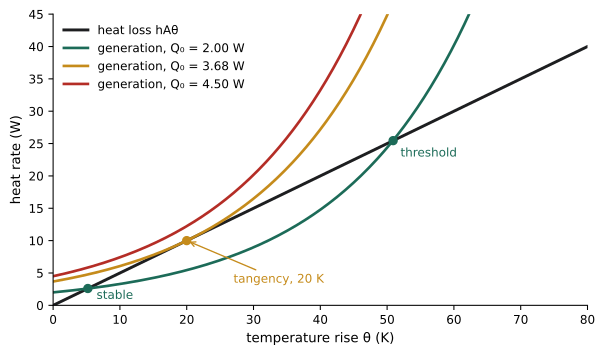
A lithium-ion cell generates heat internally, and its side reactions speed up as it warms. The cell loses heat to its surroundings in proportion to its temperature rise. If generation grows faster with temperature than the losses can, the cell can enter thermal runaway. A simple lumped model (Semenov's model of thermal explosion) for the temperature rise \(\theta\) above ambient is:
This is an autonomous first-order equation (Lesson 2). Its equilibria are where the generation curve \(Q_0e^{\beta\theta}\) meets the loss line \(hA\,\theta\). For modest \(Q_0\) they cross twice: a stable operating point and, above it, an unstable threshold. As \(Q_0\) increases, the two equilibria merge when the curve is tangent to the line, a saddle-node bifurcation. Tangency requires equal values and equal slopes: \(Q_0e^{\beta\theta} = hA\theta\) and \(\beta Q_0e^{\beta\theta} = hA\), which give \(\theta = 1/\beta\) and the critical generation:
import numpy as np
from scipy.optimize import brentq

# Cell heating: m c dT/dt = Q0 exp(beta T) - hA T, with T the rise above ambient
hA, beta = 0.5, 0.05
Q_crit = hA / (beta * np.e)
print(f"Critical heat generation {Q_crit:.2f} W, at a rise of {1 / beta:.0f} K")

for Q0 in [1.0, 2.0, 3.0, 3.5, 4.0]:
    def net(T):
        return Q0 * np.exp(beta * T) - hA * T
    T_min = np.log(hA / (Q0 * beta)) / beta
    if net(T_min) < 0:
        stable = brentq(net, 0.0, T_min)
        unstable = brentq(net, T_min, 1000.0)
        print(f"Q0 = {Q0:.1f} W: stable at +{stable:.1f} K, runaway threshold at +{unstable:.1f} K")
    else:
print(f"Q0 = {Q0:.1f} W: no equilibrium, thermal runaway from any start")Critical heat generation 3.68 W, at a rise of 20 K Q0 = 1.0 W: stable at +2.2 K, runaway threshold at +71.5 K Q0 = 2.0 W: stable at +5.2 K, runaway threshold at +50.9 K Q0 = 3.0 W: stable at +9.8 K, runaway threshold at +35.6 K Q0 = 3.5 W: stable at +14.3 K, runaway threshold at +27.0 K Q0 = 4.0 W: no equilibrium, thermal runaway from any start
With the values shown, a cell generating 2 W settles 5.2 K above ambient and survives disturbances that warm it by up to about 45 K (to the threshold at 50.9 K). At 3.5 W the margin shrinks to about 13 K between the operating point and the threshold, and above 3.68 W there is no safe operating point at all. Battery engineers use more detailed versions of this analysis to size cooling (raising hA moves the critical point up), to set limits on charging current, and to design packs so that one failing cell does not heat its neighbors past their thresholds. The bifurcation picture explains why runaway can seem to come from nowhere: a small increase in load or a small loss of cooling near the critical point removes the stable state entirely.
Case study 3: how deep to bury a water main
Water mains in much of Canada are buried 2 to 3 m deep so that they do not freeze. The heat equation (Lesson 11) explains the number. Treat the ground as a deep uniform solid, with the surface temperature varying through the year as \(T_s = \bar{T} + A\cos\omega t\). A solution of \(u_t = \alpha u_{xx}\) that matches this surface condition and stays bounded at depth is:
Substituting confirms that it satisfies the heat equation: the decay and the phase shift with depth must both be governed by the same length d. The temperature swing shrinks by a factor of e for every damping depth d, and the peaks arrive later with depth, a lag of \(x/d\) radians.
Worked problem
Frost protection depth
At a prairie site, the mean annual ground surface temperature is 5 °C with an annual swing of ±15 °C, and the soil has α = 5.0 × 10⁻⁷ m²/s. How deep must a pipe be for the ground around it never to fall below 0 °C, and when is the coldest time at that depth?
Show solution
- \(\omega = 2\pi/(365 \times 86\,400) = 1.99 \times 10^{-7}\) rad/s.
- \(d = \sqrt{2 \times 5.0 \times 10^{-7}/1.99 \times 10^{-7}} = 2.24\) m.
- The minimum at depth x is \(5 - 15e^{-x/d}\). Setting it to zero: \(e^{-x/d} = 1/3\), so \(x = 2.24\ln 3 = 2.46\) m.
- Lag at that depth: \(x/d = 1.10\) rad, or \(1.10/(2\pi) \times 365 = 64\) days.
Answer: About 2.5 m, consistent with common practice on the prairies. The coldest ground at that depth occurs about two months after the coldest surface weather, so pipes are most at risk in March, not January. Real designs also account for snow cover (which insulates), latent heat of freezing soil moisture and the reduced cover under roads cleared of snow.
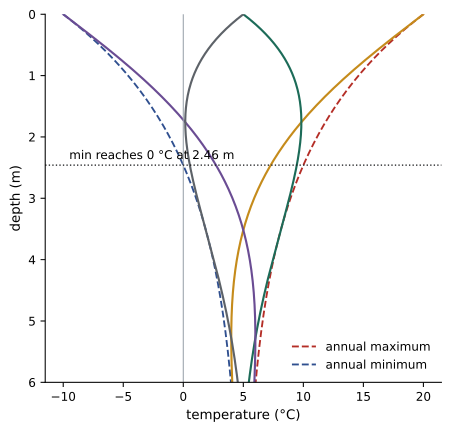
The same solution describes the daily temperature cycle in a concrete wall (with d of only about 10 to 15 cm, which is why thick walls smooth out daily swings), the skin depth of alternating current in a conductor, and the way tides penetrate into a coastal aquifer.
Common threads
The three case studies used different mathematics but the same process:
- Formulate: identify the state variables and write a balance (force, energy, mass) for each, stating every assumption.
- Simplify deliberately: a rigid building on isolators, a lumped cell, a uniform half-space. Each simplification should be one you can defend and later relax.
- Analyze before solving: find equilibria, stability, natural frequencies and time scales, since they reveal the behavior and make good checks.
- Solve by the simplest adequate method: formula, transform, series or numerical integration.
- Verify: check units, limiting cases, symmetry, a known special case or a second method.
- Interpret: translate the result into a design decision with a safety margin, and state what the model leaves out.
The course project
Choose one of the following problems, or propose your own of similar scope with your instructor's approval, and prepare a technical report with your formulation, analysis, solution (analytical where possible, numerical where necessary), verification and interpretation.
- Project A: Vehicle suspension. Model a quarter-car with a sprung and an unsprung mass (two degrees of freedom). Find its natural frequencies and modes, its frequency response to a sinusoidal road profile, and its response to a speed bump. Choose spring and damper values that balance ride comfort against road holding, and justify your choice.
- Project B: Process control. Model a tank, heater or motor as a transfer function from data or physical laws. Design P and PI controllers, find the closed-loop poles, steady-state error and step response, and determine the gain at which the loop becomes unstable. Simulate the response to a disturbance.
- Project C: Heat transfer. Analyze transient conduction in a wall, slab or fin of your choice using a Fourier series and a finite-difference model, and compare them. Use your model to answer a design question, such as the insulation thickness or fin length needed to meet a temperature limit.
- Project D: Nonlinear dynamics. Study a nonlinear system (a pendulum with forcing, a Duffing oscillator, a predator-prey or competition model with harvesting, or an electronic oscillator). Find its equilibria and their stability, draw its phase portrait numerically, identify any limit cycles or bifurcations, and explain their engineering significance.
Every report should state the governing equations and the laws they come from, list assumptions and parameter values with sources, check the solution by at least one independent means, examine sensitivity to the most uncertain parameter, and end with clear conclusions for a non-specialist reader.
Working with software
Professional practice relies on software: Python with SciPy, MATLAB and Simulink, circuit simulators, and finite element programs. Each solves differential equations numerically, and each will produce plausible-looking numbers from a wrong model or a poorly chosen tolerance. The methods of this course are what make the software trustworthy: an engineer who knows the natural frequency, time constant or equilibrium in advance can spot a wrong result immediately. A good habit is to solve a simplified version by hand first, then use software for the full problem and confirm that it reproduces the simple case.
Looking ahead
Differential equations run through the rest of an engineering program. Numerical methods (MATH-300) develop the solvers used throughout this course and analyze their accuracy and stability. Courses in vibrations, control systems, heat transfer, fluid mechanics, circuits and electromagnetics are each built on particular differential equations, and they will use transfer functions, modes, Fourier series and phase-plane ideas without stopping to re-derive them. The habits practiced here, formulating carefully, checking constantly and interpreting honestly, are the ones that matter most.
Common mistakes
MistakeStarting a numerical simulation before analyzing the model.
InsteadFind equilibria, time scales and frequencies first; they guide and check the simulation.
MistakeIsolating a system whose forcing frequency is below √2 times its natural frequency.
InsteadIsolation reduces transmitted motion only for r > √2.
MistakeAssuming a stable operating point will always remain stable.
InsteadCheck how close the system is to a bifurcation, where small changes remove stability.
MistakeReporting a model result without stating its assumptions.
InsteadList the simplifications and how they might change the answer.
MistakeTrusting software output without an independent check.
InsteadReproduce a simple case by hand, and test sensitivity to tolerances and inputs.
Summary and key terms
- Real problems start with a physical question and need a model, a method, verification and interpretation.
- Base isolation lowers a building's natural frequency so that ground shaking falls in the isolation range r > √2.
- Thermal runaway is a saddle-node bifurcation; the critical generation is hA/(βe).
- The annual temperature wave decays into the ground over the damping depth d = √(2α/ω), with a time lag.
- Frost protection depth follows from the exponential decay of the surface temperature swing.
- Analyzing equilibria and time scales before solving is the best check on any result.
- The course project applies the full modeling process to a system of your choice.
- Base isolation
- Flexible bearings that lower a building's natural frequency to reduce transmitted ground motion.
- Transmissibility
- The ratio of transmitted to input motion amplitude in steady vibration.
- Frequency ratio
- r = ω/ωₙ, the forcing frequency divided by the natural frequency.
- Thermal runaway
- Uncontrolled temperature rise when heat generation outpaces heat loss.
- Semenov diagram
- A plot of heat generation and heat loss against temperature showing equilibria.
- Damping depth
- d = √(2α/ω), the depth over which a periodic temperature swing falls by a factor of e.
- Phase lag
- The delay of a periodic response relative to its forcing.
- Model verification
- Checking that a model's solution is correct by independent means.
Practice problems
Work each problem on paper first, then reveal the answer to check.
Find the transmissibility at r = 3 with ζ = 0.1.
Show answer
√(1 + 0.36)/√(64 + 0.36) = 1.166/8.02 = 0.145.
At what frequency ratio does transmissibility equal 1 for any damping?
Show answer
r = √2.
An isolated building has period 3.0 s. Above what ground frequency does isolation reduce motion?
Show answer
f > √2/3.0 = 0.47 Hz.
For the cell model with hA = 1.0 W/K and β = 0.05 K⁻¹, find the critical generation.
Show answer
1.0/(0.05e) = 7.36 W.
At the critical point, what is the temperature rise?
Show answer
1/β = 20 K.
Why does improved cooling make runaway less likely?
Show answer
Raising hA raises the critical generation and widens the margin to the threshold.
Find the damping depth for the daily cycle in concrete with α = 7 × 10⁻⁷ m²/s.
Show answer
ω = 7.27 × 10⁻⁵ rad/s; d = √(2 × 7 × 10⁻⁷/7.27 × 10⁻⁵) = 0.14 m.
At what depth is the annual swing one tenth of its surface value if d = 2.24 m?
Show answer
x = 2.24 ln 10 = 5.2 m.
If the surface swing in case study 3 were ±20 °C with the same mean, how deep must the pipe be?
Show answer
e^(−x/d) = 1/4: x = 2.24 ln 4 = 3.1 m.
List three ways to verify a numerical solution.
Show answer
For example: compare with an analytical special case, check limiting behavior or conservation laws, and refine the step size or tolerance.
Lesson quiz · 5 questions
Score 60% or more to complete this lesson.
Create a free account to save your progress, take quizzes and earn a certificate.