
PHOT-301 · Lesson 1 of 12 · 25 min
Color vision and color science for photographers
Color management exists because color is not a property of objects alone. It is produced by light, modified by surfaces and inks, captured by sensors, reproduced by displays and printers, and finally interpreted by a human visual system that adapts constantly to its surroundings. A photographer who wants a print to match the screen, a client's product to look right in a catalog, or a series of prints to look consistent on a gallery wall needs to understand each of these steps. This course takes you from the science of color through the ICC color management system, monitor calibration, viewing conditions, profiling, soft proofing, printers, inks and papers, to making and preserving fine prints. This first lesson lays the foundation: how light and surfaces create color, how human vision works, how color is measured, the CIE color spaces that make color management possible, color difference and Delta E, and the perceptual effects that make color matching harder than it looks.
Light, surfaces and color
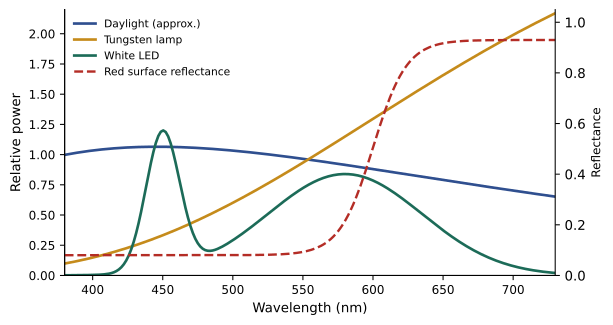
Visible light is electromagnetic radiation with wavelengths from roughly 380 to 730 nanometers. A light source has a spectral power distribution (SPD): the amount of energy it emits at each wavelength. Daylight has a smooth, broad SPD; incandescent bulbs emit more energy toward the red end; fluorescent and LED sources often have peaks and gaps. When light falls on a surface, the surface reflects a fraction of the light at each wavelength, described by its spectral reflectance curve. A red apple reflects much of the long-wavelength light and absorbs most of the short wavelengths. The light that reaches the eye, or a camera, is the product of the source SPD and the surface reflectance at every wavelength. This is the first reason color management is complex: the same print looks different under different light, because the light it reflects changes.
Here \(E(\lambda)\) is the illuminant's spectral power, \(R(\lambda)\) the surface reflectance and \(S(\lambda)\) the reflected light reaching the viewer at wavelength \(\lambda\).
How human vision sees color
The retina contains rods, which handle low-light vision and do not distinguish color, and three types of cone cell, sensitive to long (L), medium (M) and short (S) wavelengths, sometimes loosely called red, green and blue cones. Every color sensation is reduced to three numbers: the responses of the three cone types. This trichromacy has a remarkable consequence: two lights or surfaces with completely different spectra can produce identical cone responses and therefore look identical. Such pairs are called metamers, and metamerism is what makes color reproduction possible at all, since a display with three primaries or a printer with a handful of inks can never reproduce the spectrum of a real flower, only a metameric match to it.
Metamerism also creates problems. A match that works under one light may fail under another, because the two spectra respond differently when the illuminant changes. This is called illuminant metamerism, or metameric failure, and it explains why two prints that match in the studio may look different in a gallery lit by tungsten spotlights, or why a dyed fabric may not match its photograph under shop lighting. Observer metamerism is related: people's cone sensitivities differ slightly, so a match that looks perfect to one person may not to another, a problem that has grown with wide-gamut displays with narrow-band primaries.
About 8 % of men and 0.5 % of women of Northern European descent have some form of color vision deficiency, most commonly a reduced sensitivity in the L or M cones. Photographers with color vision deficiency can still manage color reliably by relying on measurement, numbers and calibrated tools rather than visual judgment alone.
Measuring color: from spectra to numbers
Color science needed a way to describe colors numerically, independent of any particular device. In 1931, the Commission Internationale de l'Éclairage (CIE) defined the standard observer: a set of three color-matching functions, derived from experiments in which observers matched spectral colors with mixtures of three primaries. Integrating a light's spectrum against these functions gives three numbers, the tristimulus values X, Y and Z. Y corresponds to luminance, perceived brightness. Any two stimuli with the same XYZ values match for the standard observer. A 1964 supplementary observer, using a 10-degree field of view instead of 2 degrees, is used in some industries.
Instruments measure color in two main ways. Colorimeters use three or more filtered sensors that imitate the color-matching functions; they are fast and inexpensive and are used to calibrate monitors. Spectrophotometers measure the full spectrum in narrow bands, typically every 10 nanometers, and calculate XYZ for any chosen illuminant and observer; they are used to profile printers and measure prints, and can also measure displays.
Chromaticity and the CIE diagram
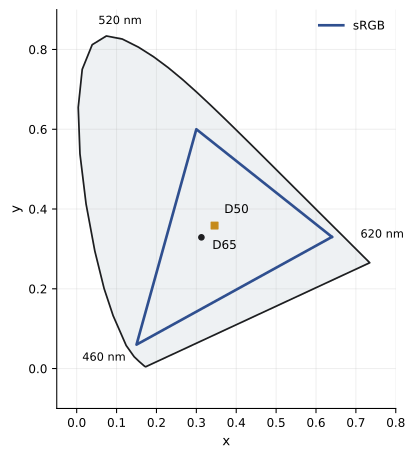
Dividing X and Y by the sum X + Y + Z gives the chromaticity coordinates x and y, which describe a color's hue and saturation without its brightness. Plotting them produces the familiar horseshoe-shaped CIE 1931 chromaticity diagram, with pure spectral colors around the curved edge and the line of purples joining the ends. White points such as D50 and D65 sit near the middle. Device gamuts, the ranges of colors a display or printer can reproduce, appear as triangles or irregular shapes inside. The diagram is excellent for showing gamuts and white points, but it is not perceptually uniform: equal distances in different regions do not correspond to equal perceived differences, with the green region greatly exaggerated.
CIELAB: a perceptual color space
To describe color differences meaningfully, the CIE introduced CIELAB (L*a*b*) in 1976. L* represents lightness from 0 (black) to 100 (diffuse white); a* runs from green (negative) to red (positive); b* runs from blue (negative) to yellow (positive). CIELAB is calculated from XYZ relative to a reference white, usually D50 in graphic arts and photography, using cube-root functions that roughly match the eye's response to lightness. It is approximately perceptually uniform, so similar distances represent similar perceived differences across most of the space. CIELAB is the language of color management: printer profiles, measurement tools and quality standards express colors as Lab values. The related LCh form describes the same colors as lightness, chroma (colorfulness) and hue angle, which is often more intuitive: a skin tone might be described as L* 65, C* 25, h 55°.
Here \(X_n, Y_n, Z_n\) are the tristimulus values of the reference white and \(f(t) = t^{1/3}\) for most values, with a linear segment near black.
Color difference and Delta E
Delta E (\(\Delta E\)) measures how different two colors are. The original 1976 formula is simply the straight-line distance between two points in CIELAB:
Because CIELAB is not perfectly uniform, especially for saturated colors and blues, later formulas weight the differences in lightness, chroma and hue. CIEDE2000, usually written \(\Delta E_{00}\), is the current standard in graphic arts and display calibration; it is more complex but agrees better with what people see. As a rough guide, a \(\Delta E_{00}\) below 1 is generally imperceptible in side-by-side comparison, 1 to 2 is perceptible only to trained eyes, 2 to 3.5 is noticeable on close inspection, and above 5 colors look clearly different. Tolerances depend on context: a product color on a website, a reproduction of a painting and a neutral gray in a black-and-white print each need different precision.
Worked problem
Comparing a print patch with its target
A proof of a brand-color patch measures L* 52.0, a* 61.0, b* 38.0. The target is L* 50.0, a* 63.0, b* 40.0. What is the 1976 Delta E, and is the difference likely to be visible?
Show solution
- Differences: \(\Delta L^* = 2.0\), \(\Delta a^* = -2.0\), \(\Delta b^* = -2.0\).
- \(\Delta E^*_{ab} = \sqrt{2.0^2 + 2.0^2 + 2.0^2} = \sqrt{12} \approx 3.5\).
- For a saturated red, CIEDE2000 typically gives a smaller value, perhaps around 2, because it weights chroma differences less in saturated colors.
- A difference of this size is noticeable side by side, so it would usually be adjusted for brand work.
Answer: About 3.5 \(\Delta E^*_{ab}\) (roughly 2 \(\Delta E_{00}\)), noticeable side by side; adjust for critical brand color.
| Delta E 2000 | Typical interpretation |
|---|---|
| Below 1 | Generally not perceptible side by side |
| 1–2 | Perceptible to trained observers in close comparison |
| 2–3.5 | Noticeable on close inspection |
| 3.5–5 | Clearly noticeable, acceptable only for non-critical work |
| Above 5 | Obviously different colors |
Chromatic adaptation and appearance
Human vision adapts to the color of the light around us. A white sheet of paper looks white under tungsten light and under daylight, even though the light it reflects differs greatly, because the visual system rebalances its sensitivity, much like automatic white balance. Color management uses mathematical chromatic adaptation transforms, such as the Bradford transform, to convert colors between different white points, for example from a display's D65 white to the D50 white used in print workflows, so that a color appears the same to an adapted observer under each condition.
Many other appearance effects complicate matching. Simultaneous contrast makes a gray patch look darker on a white background and lighter on a black one, and makes colors appear shifted away from their surroundings. Brightness adaptation means a print that looks right in a dim room looks dark in bright light. The Hunt effect makes colors appear more colorful at higher luminance, and the Stevens effect makes contrast appear higher in brighter light, which is why prints viewed under dim light look flat and muddy. These effects explain why viewing conditions (Lesson 5) are as important as accurate devices, and why the same image may need different adjustments for a backlit screen, a print in a gallery and a print in a living room.
Why photographers need color management
Every device in a photographic workflow speaks its own color language. A camera records color according to its sensor's spectral sensitivities; a monitor displays color according to its primaries, white point and tone response; a printer reproduces color according to its inks, paper and driver settings. The same RGB numbers produce different colors on different devices. Color management translates between them through a device-independent reference, CIE XYZ or CIELAB, using profiles that describe each device. The result is not perfect matching, which is impossible when devices have different gamuts and media look different from screens, but predictable, consistent and controllable color. The next lesson explains how the ICC system makes this translation work.
Color and photography: a brief history
Photographers have wrestled with color reproduction since the first color processes. James Clerk Maxwell demonstrated additive color photography in 1861 by projecting three black-and-white images taken through red, green and blue filters. The autochrome plates of the Lumière brothers, introduced in 1907, used dyed potato starch grains as tiny color filters. Kodachrome (1935) and later color negative films brought color photography to millions, with each film stock rendering color in its own characteristic way. Darkroom color printing required careful filtration and test prints to match negatives. Digital imaging brought new possibilities and new problems, which color management was created to solve.
Common mistakes
MistakeJudging color under any convenient light.
InsteadEvaluate prints under a known, standard light source.
MistakeAssuming two prints that match in the studio will match everywhere.
InsteadRemember metamerism: check matches under the display lighting.
MistakeUsing the CIE xy diagram to judge color differences.
InsteadUse CIELAB and Delta E 2000 for differences.
MistakeTreating any Delta E value as pass or fail without context.
InsteadSet tolerances for the color and use.
MistakeRelying only on your eyes for critical color.
InsteadCombine visual judgment with measurement.
Summary and key terms
- Reflected color is the product of the light source spectrum and the surface reflectance.
- Three cone types reduce every color to three responses, making metamers possible.
- Metameric matches can fail under different light or between observers.
- CIE XYZ, based on the standard observer, describes color independent of devices.
- CIELAB is approximately perceptually uniform and is the language of color management.
- Delta E 2000 quantifies color differences; below about 1 is imperceptible.
- Adaptation and appearance effects make viewing conditions critical.
- Spectral power distribution
- Energy emitted by a light source at each wavelength.
- Spectral reflectance
- Fraction of light a surface reflects at each wavelength.
- Trichromacy
- Color vision based on three cone types.
- Metamerism
- Different spectra producing the same color appearance.
- Standard observer
- CIE color-matching functions representing average vision.
- Tristimulus values
- The X, Y and Z values of a color.
- CIELAB
- Approximately uniform color space with L*, a* and b*.
- Delta E 2000
- Current standard formula for color difference.
- Chromatic adaptation
- Adjustment of vision to the color of the light.
- Simultaneous contrast
- Change in apparent color caused by surroundings.
Practice problems
Work each problem on paper first, then reveal the answer to check.
What is the visible wavelength range?
Show answer
About 380–730 nm.
What determines the light reflected by a print?
Show answer
The light source spectrum multiplied by the paper and ink reflectance.
What are metamers?
Show answer
Different spectra that look the same.
What is illuminant metamerism?
Show answer
A match failing when the light changes.
What does Y represent in XYZ?
Show answer
Luminance.
Why is the xy diagram poor for differences?
Show answer
It is not perceptually uniform.
What do a* and b* represent?
Show answer
Green–red and blue–yellow axes.
Delta E 1976 between L*50 a*0 b*0 and L*53 a*4 b*0?
Show answer
5.0.
What Delta E 2000 is generally imperceptible?
Show answer
Below about 1.
Why do prints look flat in dim light?
Show answer
Hunt and Stevens effects reduce perceived colorfulness and contrast.
Lesson quiz · 5 questions
Score 60% or more to complete this lesson.
Create a free account to save your progress, take quizzes and earn a certificate.