
PMP-130 · Lesson 12 of 12 · 25 min
Capstone: integrated planning and calculation strategy for the exam
This final lesson brings the course together in two ways. First, it revisits Project Compass at a single status date and shows how scope, schedule and cost information combine into one picture for decision-making, including the agile measures used for the app. Second, it gives a structured approach to the calculation and situational questions on scope, schedule and cost that appear on the PMP exam: which formulas to know, how to read a question, common traps and how to check an answer quickly. Quality, risk, procurement and change control, which complete the Process domain, follow in PMP-131.
Project Compass at month 6
At the end of month 6, the project manager prepares an integrated status review for the board. The fit-out has reached the HVAC upgrade; the app team has completed six sprints; overall earned value is available from the control accounts. Each part tells part of the story.
# Capstone check: one status date, three views of Project Compass
import math
# 1. Fit-out schedule: PERT on the critical path (working days)
crit = [(12, 15, 21), (15, 20, 35), (8, 10, 14), (16, 20, 30), (12, 15, 21),
        (8, 10, 13), (6, 8, 11), (2, 2, 2)]
mean = sum((o + 4 * m + p) / 6 for o, m, p in crit)
sd = math.sqrt(sum(((p - o) / 6) ** 2 for o, m, p in crit))
z = (110 - mean) / sd
prob = 0.5 * (1 + math.erf(z / math.sqrt(2)))
print(f"Fit-out: mean {mean:.1f} days, SD {sd:.2f}; P(within 110 days) = {prob:.0%}")

# 2. Mobile app release: burn-up forecast
done, scope, velocity, growth = 128, 262, 21.3, 7.0
print(f"App: {scope - done} points left; {math.ceil((scope - done) / (velocity - growth))} sprints with growth, "
      f"{math.ceil((scope - done) / velocity)} if scope is frozen")

# 3. Whole project: earned value ($000)
BAC, PV, EV, AC = 2400, 1440, 1290, 1400
CPI, SPI = EV / AC, EV / PV
print(f"EVM: CPI {CPI:.3f}, SPI {SPI:.3f}, EAC {BAC / CPI:,.0f}, "
      f"ETC {BAC / CPI - AC:,.0f}, TCPI(BAC) {(BAC - EV) / (BAC - AC):.3f}")
reserve_left = 120 - 40                  # management reserve minus approved draws
print(f"Overrun at BAC/CPI: {BAC / CPI - BAC:,.0f} vs management reserve left {reserve_left}")Fit-out: mean 104.3 days, SD 4.84; P(within 110 days) = 88% App: 134 points left; 10 sprints with growth, 7 if scope is frozen EVM: CPI 0.921, SPI 0.896, EAC 2,605, ETC 1,205, TCPI(BAC) 1.110 Overrun at BAC/CPI: 205 vs management reserve left 80
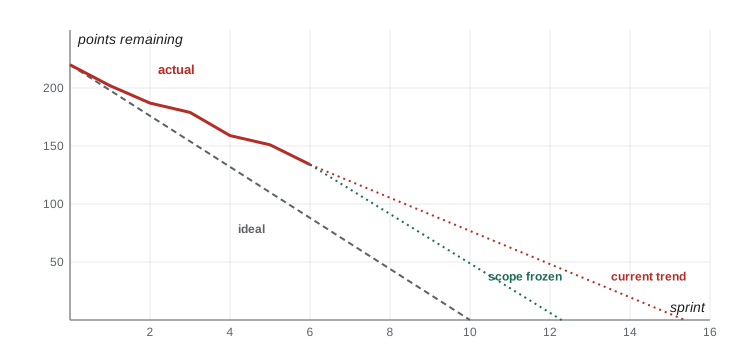
The three views agree in direction but add different information. The fit-out PERT calculation for the critical path alone suggests an 88 % chance of finishing the network within 110 working days; the Monte Carlo simulation from lesson 8, which captures merge bias, puts it nearer 61 %. The app has 134 points left; at current velocity and scope growth it needs about 10 more sprints, but the product owner can bring that down to 7 by freezing release 1 scope. Overall earned value shows a CPI of 0.92 and SPI of 0.90, with an EAC of about $2.6 million against a BAC of $2.4 million. The projected overrun of about $205,000 exceeds the $80,000 of management reserve remaining after an earlier approved draw, although some contingency reserve also remains.
The project manager's recommendations integrate scope, schedule and cost. Freeze release 1 app scope and move room booking to release 2, which protects the opening date. Rent a third encoding station for tagging, which costs about $6,000 but removes the equipment constraint found in lesson 6. Value engineer the remaining finishes. Ask the board either to approve a revised budget with a TCPI target the team can meet, or to accept defined scope reductions. Each recommendation is presented with its impact on the baselines, and any approved change goes through change control and updates the relevant baselines and forecasts.
Integration: how a change ripples
Planning outputs are linked, so a change in one area affects others. Suppose the board approves a second community room after all. The scope statement and WBS gain a work package; requirements and the traceability matrix gain entries; new activities enter the network, possibly on the critical path; durations and resources are estimated; cost estimates rise; the cost baseline and funding requirements change; and the EVM baseline is updated so that future performance is measured against the new plan. Change control exists to make this ripple deliberate and visible. PMP-131 covers the integrated change control process in detail.
| Change | Scope | Schedule | Cost |
|---|---|---|---|
| Add a second community room | New work package; updated scope statement and WBS dictionary | New activities; check critical path | New estimate; baseline and funding updated |
| Permit takes 15 days longer than planned | None | Critical path delayed unless compressed | Possible crashing cost or delay costs |
| Tag supplier raises price 10 % | None | None unless supply is delayed | Use contingency if this risk was identified |
| Product owner freezes app release 1 | Lower-value stories moved to release 2 | Release 1 date protected | Spend per sprint unchanged; fewer sprints needed |
Formulas to know
The exam expects you to know these formulas without a reference sheet. Write them down from memory during your study until you can reproduce them reliably.
| Topic | Formula |
|---|---|
| Three-point (triangular) | (O + M + P) / 3 |
| Three-point (PERT beta) | (O + 4M + P) / 6; σ = (P − O) / 6 |
| Path uncertainty | Path variance = sum of activity variances; path σ = √(sum of σ²) |
| Float | Total float = LS − ES = LF − EF; free float = earliest successor ES − EF |
| Cost slope | (crash cost − normal cost) / (normal duration − crash duration) |
| Communication channels | n(n − 1) / 2 (from PMP-121) |
| Variances | SV = EV − PV; CV = EV − AC; VAC = BAC − EAC |
| Indices | SPI = EV / PV; CPI = EV / AC |
| EAC | BAC / CPI; AC + (BAC − EV); AC + (BAC − EV) / (CPI × SPI); AC + bottom-up ETC |
| ETC | EAC − AC (or a bottom-up re-estimate) |
| TCPI | (BAC − EV) / (BAC − AC) or (BAC − EV) / (EAC − AC) |
| Earned schedule | SV(t) = ES − AT; SPI(t) = ES / AT |
| Agile forecast | Remaining points / (velocity − scope growth per iteration) |
Beyond formulas, know the rules of thumb: forward pass takes the largest predecessor EF, backward pass the smallest successor LS; crash the cheapest critical activity first; leveling may extend the schedule, smoothing does not; contingency is in the cost baseline, management reserve is not; BAC excludes management reserve; and negative variances or indices below 1 are unfavorable.
A method for calculation questions
Calculation questions are usually short, but under time pressure it is easy to misread them. A consistent method helps.
- Read the last sentence first, so you know what is being asked: SPI, EAC, float, probability.
- Identify the data given and write it down: BAC, PV, EV, AC; or O, M, P; or network durations.
- Check the assumption: does the question say performance will continue, the variance was one-off, or the date is fixed?
- Choose the formula and calculate, keeping enough decimal places until the end.
- Sanity-check: is the answer in the right direction? If CPI is below 1, EAC should exceed BAC. If an activity is critical, its float should be zero.
- Look at the options: if two are close, recheck the formula variant (triangular versus PERT, TCPI on BAC versus EAC).
Worked problem
A combined calculation
A project has BAC $1.2 million. At month 5, PV is $500,000, EV $450,000 and AC $480,000. The sponsor asks whether the project can still finish within budget, and what efficiency would be needed. The overrun so far reflects consistently lower productivity.
Show solution
- SPI = 450 / 500 = 0.90; CPI = 450 / 480 = 0.9375.
- Because lower productivity is expected to continue, EAC = BAC / CPI = 1,200 / 0.9375 = $1.28 million; VAC = −$80,000.
- TCPI to meet BAC = (1,200 − 450) / (1,200 − 480) = 750 / 720 ≈ 1.042.
- Interpretation: the team would need to work at 104 % cost efficiency for the rest of the project, compared with 94 % so far. Possible but demanding; the sponsor should plan for an overrun unless productivity can be improved.
Answer: EAC about $1.28 million; meeting the $1.2 million budget requires a TCPI of about 1.04, well above the current CPI of 0.94.
Situational questions on scope, schedule and cost
Many questions on these topics are situational rather than numerical. They describe a problem and ask what the project manager should do next. Patterns from this course include:
| Scenario | Typical best response |
|---|---|
| A stakeholder asks informally for extra work | Clarify the need and route it through change control with impact analysis |
| A deliverable passed quality control but the customer will not accept it | Review acceptance criteria with the customer (validate scope); resolve gaps through defect repair or change requests |
| The schedule cannot meet an imposed date | Analyze compression and scope options with costs and risks; present them to the decision-maker |
| A resource is overallocated and the date is fixed | Resource smoothing within float, or add resources |
| The sponsor wants a lower estimate | Explain the basis of estimates and offer options; do not simply cut the number |
| CPI below 1 with a consistent trend | Investigate causes at control account level, forecast with BAC / CPI, report honestly and propose corrective action |
| An identified risk occurs | Implement the planned response using contingency reserve |
| An unforeseen problem within scope occurs | Request management reserve from the sponsor; update the baseline through change control |
| Backlog scope is growing faster than velocity | Make the trend visible and let the product owner reprioritize or adjust release scope |
Underlying these patterns are a few principles the exam rewards. Analyze before acting. Use the agreed processes, such as change control and the risk management plan, rather than acting unilaterally. Involve the right decision-maker. Be honest about variances and forecasts. Prefer options that address root causes over those that hide symptoms. And tailor the approach: an answer that applies heavy predictive process to a small adaptive team, or no process to a regulated construction project, is usually wrong.
Agile measures for scope, schedule and cost
Hybrid projects report adaptive work with its own measures, which the exam expects you to read. A burndown chart shows remaining work against time, sloping down toward zero; a burn-up chart shows completed work rising toward a total scope line, which makes scope changes visible. Velocity is completed points per iteration. A cumulative flow diagram shows how many items are in each state (to do, in progress, done) over time; widening bands in progress signal a bottleneck. Cost per iteration or per point links agile progress to budget, and a simple agile EVM can treat each iteration's planned points as planned value. PMP-140 covers these in detail; for this course, be able to forecast a finish from velocity and scope growth, and recognize what a widening gap on a burn-up chart means.
Final checklist for planning
Before you baseline a plan on a real project, or answer a planning question on the exam, check the following. Are requirements clear, prioritized and traced? Does the scope statement list deliverables, acceptance criteria and exclusions? Does the WBS include 100 % of the work, including project management? Are activities linked with sound logic and no open ends? Are durations based on documented estimates with ranges? Has the critical path been identified and checked against resource limits? Has schedule risk been considered, and is the committed date at an agreed confidence level? Do cost estimates cover all resources, with escalation and contingency? Is the cost baseline time-phased and reconciled with funding? Are reserves explicit and controlled by the right people? Is there a way to measure progress objectively, such as earned value for predictive work and burn charts for adaptive work?
A plan that passes these checks will still change, because projects are uncertain. But it gives the team a sound basis to coordinate, the sponsor a fair basis to hold the project to account, and the project manager an early warning when reality departs from the plan.
Common mistakes
MistakeChoosing an EAC formula without reading the assumption in the question.
InsteadMatch the formula to what the scenario says about future performance.
MistakeReporting status from one view only, such as spending.
InsteadIntegrate scope, schedule and cost information, including adaptive measures, into one picture.
MistakeTreating a deterministic critical path date as certain.
InsteadUse three-point estimates or simulation and state confidence levels.
MistakeMaking changes to plans without updating the related baselines.
InsteadTrace the ripple of each approved change through scope, schedule and cost documents.
MistakeRushing calculation questions.
InsteadRead what is asked, list the data, choose the formula, calculate and sanity-check.
Summary and key terms
- Integrated status combines critical path, schedule risk, agile burn charts and earned value.
- Approved changes ripple through requirements, scope, schedule, cost and the EVM baseline.
- Know the formulas for three-point estimates, float, cost slope, EVM, TCPI, earned schedule and agile forecasts.
- Use a consistent method for calculations: question, data, assumption, formula, sanity check, options.
- Situational answers favor analysis, agreed processes, the right decision-maker and honesty.
- Adaptive measures (burn-up, burndown, velocity, cumulative flow) report scope and schedule for agile work.
- Baseline only a plan that passes a structured completeness and realism check.
- Integrated status review
- A report combining scope, schedule, cost and risk information for decision-making.
- Burndown chart
- A chart of work remaining over time in an iteration or release.
- Burn-up chart
- A chart of work completed against total scope over time.
- Velocity
- The amount of work, usually in story points, a team completes per iteration.
- Cumulative flow diagram
- A chart showing the number of work items in each state over time.
- Corrective action
- An activity that realigns project performance with the plan.
- Rebaselining
- Approving a new baseline through change control after significant change.
- Sanity check
- A quick test of whether a calculated answer is plausible.
- Confidence level
- The probability that a date or cost will not be exceeded, such as P80.
- Agile earned value
- An adaptation of EVM using planned points per iteration as planned value.
Practice problems
Work each problem on paper first, then reveal the answer to check.
BAC 600, PV 300, EV 240, AC 270. CPI and SPI?
Show answer
CPI = 0.889; SPI = 0.80.
Same project: EAC if performance continues?
Show answer
600 / 0.889 = 675.
Same project: TCPI to meet BAC?
Show answer
(600 − 240) / (600 − 270) = 360 / 330 ≈ 1.09.
O 10, M 14, P 24. PERT estimate and σ?
Show answer
E = (10 + 56 + 24) / 6 = 15; σ = 14 / 6 ≈ 2.33.
Remaining 180 points, velocity 24, scope growth 4 per sprint. Sprints to finish?
Show answer
180 / 20 = 9 sprints.
An identified risk occurs. Which reserve?
Show answer
Contingency reserve.
The board adds scope. What must be updated?
Show answer
Requirements, scope statement, WBS and dictionary, schedule, cost estimates, cost baseline and funding, through change control.
On a burn-up chart, what does a rising total scope line mean?
Show answer
Scope is being added to the release.
Widening in-progress band on a cumulative flow diagram?
Show answer
A bottleneck: work is entering progress faster than it is finished.
Why might SPI be 1.0 at the end of a late project?
Show answer
All planned value has been earned, so EV equals PV; use earned schedule or actual dates instead.
Lesson quiz · 5 questions
Score 60% or more to complete this lesson.
Create a free account to save your progress, take quizzes and earn a certificate.