
PRIN-130 · Lesson 9 of 12 · 26 min
Product-based planning II: product flow diagrams, dependencies and schedules
Lesson 8 defined what Ridgeline Water's project must deliver: a project product description, a product breakdown structure and product descriptions. This lesson completes product-based planning with the product flow diagram, which shows the order in which products must be created, and then follows the remaining planning steps from products to activities, dependencies, estimates and a schedule. CON-210 covers critical path scheduling in more depth in a construction setting; here the focus is on how PRINCE2 connects the schedule to products.
The product flow diagram
A product flow diagram (PFD) shows the sequence in which products are developed and the dependencies between them. It is usually drawn from top to bottom or left to right, starting with products that exist already or come from outside the project, and ending with the final product. Every product in the lowest level of the product breakdown structure should appear in the PFD, and the arrows show which products must exist before another can be created. Intermediate groupings from the PBS do not appear, because they are not real products.
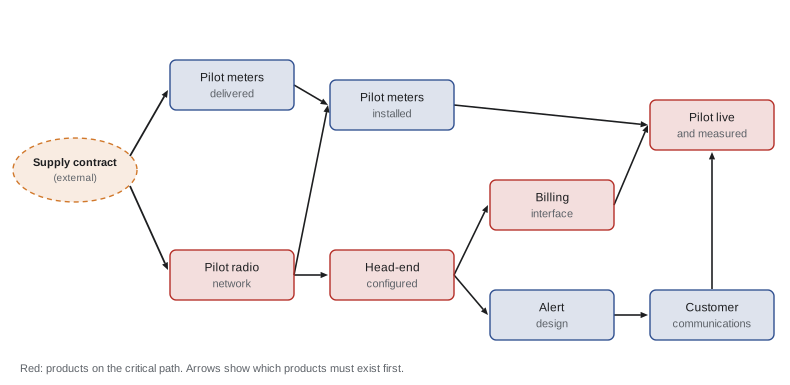
Drawing the PFD is often where planning teams discover misunderstandings. In Ridgeline Water's case, the IT team assumed it could build the billing interface as soon as the meters arrived, but the supplier pointed out that the interface needs the head-end system configured, which in turn needs the radio network. That single conversation moved the billing interface later and changed the critical path. A PFD is cheap to draw and to change, so it is the right place to have these conversations.
| Dependency type | Meaning | Ridgeline Water example |
|---|---|---|
| Internal | Between two products within the project | Alert design depends on the head-end system being configured |
| External | On a product or decision outside the project's control | Pilot meters depend on the supplier contract and delivery |
| Management | On a decision or approval within the project | Rollout depends on the board's approval at the end of the pilot |
External dependencies deserve their own scrutiny. They should be monitored, and the plan should note who outside the project is responsible for each one. A delay in an external product is often the earliest warning of a stage exception, because the project cannot speed it up by its own efforts.
From products to activities
Once the products and their sequence are known, the planner identifies the activities needed to create each product, including the quality activities from each product description, such as reviews and tests, and the management activities such as stage-end reporting. For simple products, one activity may be enough; for complex products, several. Activities are then given dependencies, which mostly follow the product dependencies, plus any extra ones such as a resource that cannot do two things at once.
| Product | Activities | Quality activity from the product description |
|---|---|---|
| Pilot radio network | Survey sites; install collectors; commission network | Coverage test: at least 98 % of pilot addresses reachable |
| Head-end configured | Install software; configure meter profiles; connect to network | Acceptance test of daily read collection |
| Billing interface | Design mapping; build interface; migrate pilot meter records | End-to-end billing test on 500 sample accounts |
| Alert design | Analyze flow patterns; draft rules and messages; test with customers | Usability test: at least 80 % understand the action |
| Customer communications | Draft letters and web content; translate; print and send | Review by customer operations and accessibility specialist |
Including quality activities as explicit activities is important. A plan that lists build the billing interface but not the end-to-end billing test will look shorter and cheaper than it really is, and the test will either be skipped or will cause a delay. PRIN-131 covers how quality activities are recorded in the quality register.
Estimates and the schedule
With activities and dependencies identified, the planner estimates each activity, using the techniques from lesson 7, and builds a schedule. A widely used method is the critical path method: a forward pass calculates the earliest start and finish of each activity, a backward pass calculates the latest start and finish that would not delay the end date, and the difference is the float. Activities with zero float form the critical path; any delay to them delays the whole stage.
The code below applies the method at product level to the pilot stage, using durations in weeks. It first sorts the products into an order where every product comes after its predecessors, then runs the forward and backward passes.
products = {   # name: (duration in weeks, predecessors)
    "Supply contract":         (0, []),
    "Pilot meters delivered":  (4, ["Supply contract"]),
    "Pilot radio network":     (6, ["Supply contract"]),
    "Head-end configured":     (5, ["Pilot radio network"]),
    "Pilot meters installed":  (5, ["Pilot meters delivered", "Pilot radio network"]),
    "Billing interface":       (8, ["Head-end configured"]),
    "Alert design":            (4, ["Head-end configured"]),
    "Customer communications": (3, ["Alert design"]),
    "Pilot live and measured": (8, ["Pilot meters installed", "Billing interface",
                                    "Customer communications"]),
}
# topological order (Kahn's algorithm)
indeg = {p: len(d[1]) for p, d in products.items()}
succ = {p: [] for p in products}
for p, (_, preds) in products.items():
    for q in preds:
        succ[q].append(p)
order, ready = [], [p for p in products if indeg[p] == 0]
while ready:
    p = ready.pop(0)
    order.append(p)
    for s in succ[p]:
        indeg[s] -= 1
        if indeg[s] == 0:
            ready.append(s)
# forward pass
es, ef = {}, {}
for p in order:
    d, preds = products[p]
    es[p] = max((ef[q] for q in preds), default=0)
    ef[p] = es[p] + d
end = max(ef.values())
# backward pass
lf, ls = {}, {}
for p in reversed(order):
    lf[p] = min((ls[s] for s in succ[p]), default=end)
    ls[p] = lf[p] - products[p][0]
print(f"{'product':25} {'ES':>3} {'EF':>3} {'LS':>3} {'LF':>3} {'float':>5}")
for p in order:
    fl = ls[p] - es[p]
    print(f"{p:25} {es[p]:3} {ef[p]:3} {ls[p]:3} {lf[p]:3} {fl:5}{'  critical' if fl == 0 else ''}")
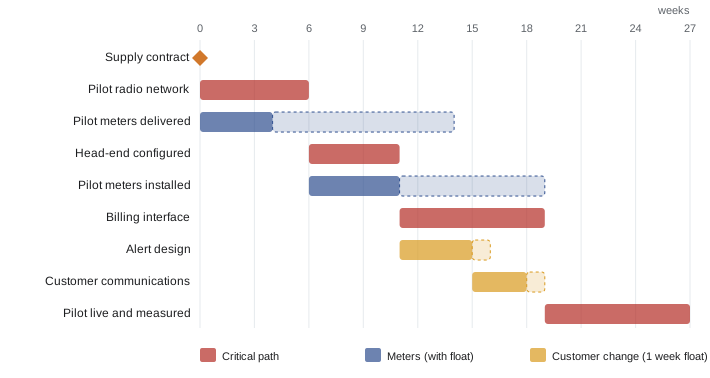
print(f"stage duration: {end} weeks")product ES EF LS LF float Supply contract 0 0 0 0 0 critical Pilot meters delivered 0 4 10 14 10 Pilot radio network 0 6 0 6 0 critical Head-end configured 6 11 6 11 0 critical Pilot meters installed 6 11 14 19 8 Billing interface 11 19 11 19 0 critical Alert design 11 15 12 16 1 Customer communications 15 18 16 19 1 Pilot live and measured 19 27 19 27 0 critical stage duration: 27 weeks
The pilot stage takes 27 weeks. The critical path runs from the supply contract through the pilot radio network, head-end configuration and billing interface to pilot live and measured. The pilot meters have ten weeks of float in delivery and eight in installation, so delays there do not affect the end date unless they exceed the float. Alert design and customer communications have only one week of float, so they are nearly critical: a small slip there would move the end date.
What the schedule tells the board
A schedule is not just a timetable for the team. It tells the board where time tolerance is fragile and which risks matter most. For Ridgeline Water's pilot, the billing interface sits on the critical path with an estimate of eight weeks; lesson 7's three-point estimate suggested the integration work could easily run longer. The board might therefore ask for an earlier start on interface design, using a test version of the head-end, or accept a wider time tolerance for the pilot stage.
| Finding from the schedule | Implication for control |
|---|---|
| Billing interface is critical and uncertain | Consider an early design start; focus risk management here |
| Alert work has only one week of float | Monitor weekly; treat as near-critical |
| Meters have large float | Delivery delays of a few weeks are tolerable; do not expedite at extra cost |
| Supply contract is an external dependency at the start | Confirm signature before the stage is authorized |
Resources and leveling
A schedule based only on dependencies assumes unlimited resources. In reality, people and equipment are limited, and two activities that could happen at the same time may need the same specialist. Resource leveling adjusts the schedule so that demand for each resource stays within what is available, usually by moving activities with float. If there is not enough float, leveling extends the schedule, and the critical path may change.
Worked problem
Leveling a shared specialist
The same data analyst is needed for alert design (4 weeks, starting week 11) and for the head-end acceptance test, which has been added as a 2-week activity at the end of head-end configuration, weeks 9 to 11. The analyst can work on only one at a time. Does this cause a conflict, and what happens if the head-end test slips by two weeks?
Show solution
- As planned, the head-end test ends in week 11 and alert design starts in week 11, so there is no overlap.
- If the head-end test slips two weeks, it ends in week 13 and alert design cannot start until then.
- Alert design then finishes in week 17 and customer communications in week 20.
- Pilot live and measured would start in week 20 instead of 19, delaying the stage by one week, because alert design had only one week of float.
Answer: A shared resource turns a near-critical path into a critical one. The project manager might arrange a second analyst for the head-end test or accept the one-week risk within the stage's time tolerance.
Leveling is one reason why plans need the people who will do the work. A schedule that looks fine on paper can be impossible if the same expert is booked twice. Team managers, who know their people's availability, are best placed to spot such conflicts when they plan their work packages.
Schedules in different forms
PRINCE2 does not prescribe how a schedule is presented. Bar charts, often called Gantt charts, are the most common because they are easy to read. Network diagrams show dependencies more clearly. Milestone charts suit board members who need only key dates. Agile teams may use a product roadmap and timeboxes instead of a detailed bar chart. The choice should suit the audience: the board needs milestones and the critical path; team managers need detailed task schedules.
| Format | Best for | Limitation |
|---|---|---|
| Bar chart | Most audiences; showing timing and float | Dependencies can be hard to see |
| Network diagram | Analyzing dependencies and the critical path | Hard to read for large plans |
| Milestone chart | Board and business layer | Hides the detail behind each milestone |
| Roadmap and timeboxes | Agile delivery | Less suited to showing hard dependencies |
Product-based planning in agile contexts
Product-based planning works well with agile delivery. The PBS and product descriptions define the products at a level suitable for the board, while agile teams break products down further into features and user stories in a product backlog. Timeboxes, such as two-week sprints, fix time and cost while allowing the detailed scope within each product to flex. PRIN-150 covers tailoring PRINCE2 for agile projects; here it is enough to note that the board can control at product level while teams plan iteratively below it.
| PRINCE2 planning element | Agile counterpart |
|---|---|
| Product breakdown structure | Product roadmap and epics |
| Product description and quality criteria | Epic or feature description with acceptance criteria |
| Team plan | Sprint or iteration plan from the product backlog |
| Work package | A set of features or a timebox agreed with the team |
| Time and cost tolerance | Fixed timeboxes; flexible scope tolerance within products |
Common mistakes
MistakeIncluding PBS groupings as products in the product flow diagram.
InsteadShow only real products; groupings are organizing devices.
MistakeLeaving quality activities out of the schedule.
InsteadDerive quality activities from product descriptions and schedule them.
MistakeIgnoring external dependencies until they cause a delay.
InsteadIdentify, monitor and assign an external owner to each external dependency.
MistakeBuilding a schedule on dependencies alone.
InsteadLevel resources; shared specialists can change the critical path.
MistakeShowing the board the full task schedule.
InsteadShow milestones, the critical path and where tolerance is fragile.
Summary and key terms
- The product flow diagram shows the order in which products are created and their dependencies.
- Drawing the PFD exposes misunderstandings about sequence early, when they are cheap to fix.
- Activities, including quality and management activities, are derived from products.
- The critical path method finds the activities with zero float that determine the end date.
- The schedule tells the board where time tolerance is fragile and where to focus risk management.
- Resource leveling can extend the schedule and change the critical path.
- Product-based planning combines well with agile backlogs and timeboxes.
- Product flow diagram
- A diagram showing the sequence in which products are developed and their dependencies.
- Dependency
- A relationship in which one product or activity must exist or finish before another.
- External dependency
- A dependency on a product or decision outside the project's control.
- Critical path
- The sequence of activities with zero float that determines the shortest possible duration.
- Float
- The amount by which an activity can be delayed without delaying the end date.
- Forward pass
- The calculation of earliest start and finish times.
- Backward pass
- The calculation of latest start and finish times.
- Resource leveling
- Adjusting a schedule so resource demand stays within availability.
- Gantt chart
- A bar chart showing activities against time.
- Timebox
- A fixed period of time in which a team delivers as much agreed scope as it can.
Practice problems
Work each problem on paper first, then reveal the answer to check.
What does an arrow in a product flow diagram mean?
Show answer
The earlier product must exist before the later one can be created.
Do PBS groupings appear in the PFD?
Show answer
No; only real products do.
In the pilot stage, which product has ten weeks of float?
Show answer
Pilot meters delivered.
What is the pilot stage duration?
Show answer
27 weeks.
Name two products on the pilot's critical path.
Show answer
For example pilot radio network and billing interface.
Activity A: ES 5, duration 3; it is followed by B with LS 10. What is A's float if B is its only successor?
Show answer
2 weeks (LF 10 − EF 8).
Why include quality activities in the schedule?
Show answer
Otherwise the plan looks shorter and cheaper than it is and tests get skipped.
What can resource leveling do to the critical path?
Show answer
Change it, and extend the schedule if there is not enough float.
Which schedule format suits the board best?
Show answer
A milestone chart or summary showing the critical path.
What is the agile counterpart of a team plan?
Show answer
A sprint or iteration plan.
Lesson quiz · 5 questions
Score 60% or more to complete this lesson.
Create a free account to save your progress, take quizzes and earn a certificate.