
SLS-230 · Lesson 9 of 12 · 26 min
Pipeline and forecast reviews
▶ Video coming soon A video version of this lesson is on the way.
Every Monday at 8:30, Darnell Brooks met each of his account executives for twenty minutes to go through their pipeline, and every Thursday at 10:00 Rob Kowalski held a forecast call with Darnell, Owen Pelletier, Farida Haddad and Grace Liu. On Thursday, November 12, 2026, with eighteen days left in the fourth quarter of fiscal 2026, the call mattered more than usual. The team had booked 512,000 dollars of first-year revenue so far in the quarter against a quarterly quota of 750,000, and Rob had to tell the owners the next morning what the quarter and the year would finish at.
Grace's work earlier in the fall had shown that Ridgeline's leadership forecasts two weeks before the end of a quarter had been, on average, about 10 in 100 away from the result, and usually too optimistic. Rob wanted this forecast to be better, and he wanted the pipeline reviews behind it to help sellers win deals, not just report on them. This lesson covers how sales leaders run pipeline reviews and forecast calls, and how they use judgment without letting hope take over.
Two different meetings
Pipeline reviews and forecast calls are often confused, and combining them usually spoils both. A pipeline review is a working session between a manager and a seller about the seller's opportunities: which deals are real, what each needs next, where the seller should spend time and where the manager can help. It looks across the whole pipeline, including early-stage deals. A forecast call is a meeting in which managers commit to a prediction of results for a period, usually the current month or quarter, and explain the risks. It looks mainly at deals expected to close in the period.
| Pipeline review | Forecast call | |
|---|---|---|
| Purpose | Help the seller win and prioritize | Predict results and flag risk |
| Who | Manager and one seller | Sales leaders, sometimes finance |
| Time frame | All open opportunities | Mainly the current period |
| Main question | What does this deal need next? | Will this deal close in the period, and for how much? |
| Outcome | Actions for the seller and manager | A forecast number with stated risks |
Darnell kept the two apart. In Monday pipeline reviews he did not ask sellers for forecast numbers; he asked about customers. On Thursday he used what he had learned on Monday to make his own forecast for the team, which he then defended to Rob.
Running a pipeline review
A good pipeline review is short, regular and focused on a few deals. Darnell asked each seller to bring their five most important open opportunities, chosen by size and timing, and spent most of the twenty minutes on two or three of them. For each one he asked questions that tested whether the deal was as real as its stage suggested.
- What problem is the customer trying to solve, in their words, and what happens if they do nothing?
- Who decides, who influences, and when did you last speak to the person who signs?
- What has the customer done, rather than said, that shows the deal is moving: a meeting booked, a document shared, a budget confirmed?
- What is the next step, with a date, and who owns it on each side?
- What could stop this deal, and what are we doing about it?
The third question did most of the work. Customers often say encouraging things that commit them to nothing. Actions, such as introducing the seller to the finance director or agreeing a date to install a trial device, are better evidence. Ridgeline's sales stages already had exit criteria, the customer actions required before a deal could move to the next stage; Darnell used the review to check that each deal met the criteria for the stage it was in.
Worked problem
Inspecting a deal in the commit category
On Monday, November 9, Andrew Ferguson listed a managed print deal with a regional dental lab as "commit" for November, worth 21,000 dollars of first-year revenue. Darnell's questions found that the lab's office manager was enthusiastic and had asked for the contract, but the owner, who signs anything over 10,000 dollars, had not been met and was traveling until November 24. Ridgeline's forecast categories define commit as a deal the seller is highly confident will close in the period, with the decision maker engaged and no known obstacles. Should the deal stay in commit?
Show solution
- Check against the definition: the decision maker has not been met and is unavailable for most of the remaining period.
- Check the timing: if the owner returns on November 24, there are four business days left in the quarter to meet, agree terms and sign.
- Check the evidence of movement: the request for the contract is a good sign, but it came from someone who cannot sign.
Answer: The deal does not meet the definition of commit. Darnell moved it to best case and agreed with Andrew on an action: ask the office manager to set up a 20-minute call with the owner for the morning of November 24, with the contract and a one-page summary sent in advance. If the call happened and went well, the deal could move back to commit.
Forecast categories and why they matter
Many sales teams sort deals expected to close in the period into forecast categories, which describe the seller's and manager's confidence rather than the deal's stage. Ridgeline used three: commit, deals the team expects to close; best case, deals that could close if things go well; and pipeline, deals that are open but unlikely to close in the period. The forecast the team gives is usually the bookings already won plus commit, with best case reported as upside.
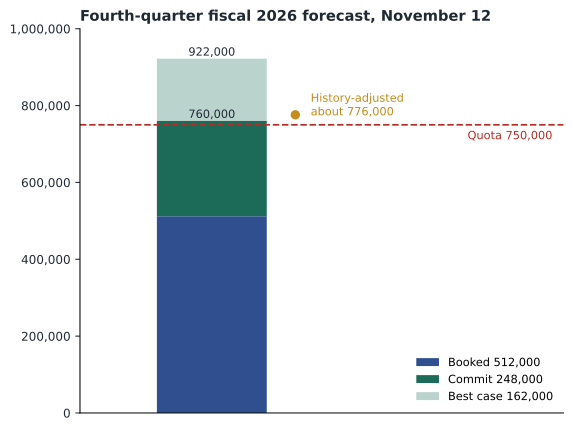
On November 12, the team had booked 512,000 dollars, and its commit category held 248,000 dollars of deals, including the Prairie Valley managed print contract, which had been selected on November 10 and was with the school division's lawyers. Best case held another 162,000 dollars. Grace's stage-weighted model gave an expected finish of about 800,000 dollars.
Worked problem
Building the quarter forecast
Booked to date: 512,000 dollars. Commit: 248,000. Best case: 162,000. Grace's historical analysis shows that, two weeks out, Ridgeline closes on average about 90 in 100 of commit dollars and about 25 in 100 of best-case dollars in the period. What are the commit forecast, the best-case forecast and a forecast adjusted for history?
Show solution
- \[\text{Commit forecast} = 512{,}000 + 248{,}000 = 760{,}000 \text{ dollars}\]
- \[\text{Best-case forecast} = 760{,}000 + 162{,}000 = 922{,}000 \text{ dollars}\]
- \[\text{History-adjusted} = 512{,}000 + 0.90 \times 248{,}000 + 0.25 \times 162{,}000 = 512{,}000 + 223{,}200 + 40{,}500 = 775{,}700\]
Answer: The commit forecast is 760,000 dollars and the best case 922,000. Adjusting for Ridgeline's history gives about 776,000. Rob told the owners to expect between 760,000 and 800,000 dollars for the quarter, with 922,000 as the upside if most best-case deals closed, and named Prairie Valley's contract as the single largest risk.
Rob's habit was to ask each leader one question about their number: "What would have to be true for this forecast to be wrong?" It drew out risks people had not volunteered: a customer's budget meeting moved, a key contact on holiday, a competitor's late price cut. Naming a risk did not change the number, but it meant that if the risk happened, nobody was surprised.
Judgment, bias and honesty
Forecasting depends on judgment, and judgment is affected by predictable biases. Sellers and managers tend to be optimistic about their own deals, especially ones they have worked hard on. Some sellers do the opposite and sandbag, under-forecasting so they can beat the number. Managers can make both worse: if a missed forecast is punished more harshly than a missed sale, sellers learn to sandbag; if bold forecasts are praised, they learn to inflate.
Rob's rules were meant to make honesty the easy choice. Forecasts would be judged by accuracy over time, not by whether they were high. A seller who moved a deal out of commit early, with a good reason, would never be criticized for it. And managers would compare each seller's past forecasts with their results, so that a habitually optimistic seller's commit could be discounted and a habitual sandbagger's could be challenged upward.
Worked problem
Measuring a seller's forecast bias
Over the last four quarters, Lisa Tran's two-weeks-out commit forecasts were 160,000, 145,000, 170,000 and 150,000 dollars, and her results were 150,000, 138,000, 155,000 and 146,000. What is her average forecast error, and in which direction?
Show solution
- Errors (forecast minus result): 10,000; 7,000; 15,000; 4,000.
- \[\text{Average error} = \frac{10{,}000 + 7{,}000 + 15{,}000 + 4{,}000}{4} = 9{,}000 \text{ dollars}\]
- \[\text{Average result} = \frac{150{,}000 + 138{,}000 + 155{,}000 + 146{,}000}{4} = 147{,}250\]
- \[\frac{9{,}000}{147{,}250} \approx 0.061 = 6.1 \text{ in } 100\]
Answer: Lisa's commit forecasts have been about 9,000 dollars, or 6 in 100, too high on average, and too high every quarter. Darnell would discuss the pattern with her and, until it changed, mentally discount her commit by about that amount.
Reviewing the floor
Bev Halvorsen's version of a pipeline review was a ten-minute stand-up at the end of each Saturday, looking at open quotes, special orders waiting for customer decisions, and month-to-date sales against plan. Furniture customers often leave with a quote and come back days later, so a seller's open quotes were their pipeline. Bev asked each seller who had a quote over 2,000 dollars whether they had arranged a follow-up, and when.
Worked problem
Forecasting the month on the floor
Juniper & Pine's floor plan for November 2026 is 1,207,500 dollars. By the end of Thursday, November 12, the floor had sold 430,000 dollars. A simple run rate would multiply the daily average by 30 days. But last November, 33 in 100 of the month's sales had come by the 12th, because Black Friday weekend falls late in the month. What do the two methods forecast?
Show solution
- \[\text{Run rate} = \frac{430{,}000}{12} \times 30 = 1{,}075{,}000 \text{ dollars}\]
- \[\text{Seasonal method} = \frac{430{,}000}{0.33} \approx 1{,}303{,}000 \text{ dollars}\]
Answer: The simple run rate suggests the store will miss plan by about 132,500 dollars; the seasonal method suggests it will beat plan by about 95,500. The seasonal method is more realistic because most of November's sales come in the final weekend, but it depends on this year's pattern matching last year's, so Bev watched the Black Friday weekend closely before telling the owners anything definite.
Caution as well as optimism
A forecast is only useful if it is usually right, so Grace kept a record of each seller's forecast and actual result every quarter. The simplest measure is the forecast error: the difference between the forecast and the actual, divided by the actual. A positive error means the forecast was too high; a negative error means it was too low. Looking at the errors over several quarters shows whether a seller or a team is consistently optimistic, consistently cautious or simply unpredictable.
Worked problem
Finding a seller's forecast bias
Over the same four quarters as Lisa's record, Kevin Moreau's commit forecasts were 140,000, 120,000, 130,000 and 150,000 dollars, and his actual bookings were 160,000, 138,000, 149,000 and 171,000 dollars. What was his average forecast error, and what does it suggest?
Show solution
- \[\frac{140 - 160}{160} = -0.125, \quad \frac{120 - 138}{138} \approx -0.130\]
- \[\frac{130 - 149}{149} \approx -0.128, \quad \frac{150 - 171}{171} \approx -0.123\]
- \[\text{Average} \approx \frac{-0.125 - 0.130 - 0.128 - 0.123}{4} \approx -0.127\]
Answer: Kevin's commit forecasts were about 13 in 100 below his actual results every quarter. That steady pattern suggests sandbagging: he is reliable but cautious. Darnell's response was not to punish him but to ask him to include deals he was fairly confident about, and to adjust Kevin's commit upward slightly in the team forecast until his own numbers became more accurate.
Consistent errors are easier to manage than random ones. A seller who is always 10 in 100 high can be adjusted for; a seller who is 30 in 100 high one quarter and 20 in 100 low the next needs coaching on how they judge deals, starting with the stage exit criteria.
Common mistakes
MistakeUsing pipeline reviews to collect forecast numbers.
InsteadKeep reviews about winning deals, and hold forecast calls separately.
MistakeAccepting a seller's description of a deal without checking evidence.
InsteadAsk what the customer has done, check stage exit criteria and confirm the decision maker is engaged.
MistakeReporting only one forecast number.
InsteadGive the commit, the best case and the main risks.
MistakePunishing forecast misses more than sales misses.
InsteadJudge forecasts on accuracy over time, and praise early, honest changes.
MistakeForecasting a seasonal month with a simple run rate.
InsteadUse the share of sales normally reached by that date, and check it against the current pattern.
Summary and key terms
- A pipeline review is a working session between a manager and a seller about winning and prioritizing deals; a forecast call is a meeting where leaders commit to a prediction for a period and explain the risks.
- Pipeline reviews should be short, regular and focused on a few deals, testing them with questions about the customer's problem, the decision maker, evidence of customer action, next steps and obstacles, and checking stage exit criteria.
- Forecast categories such as commit, best case and pipeline describe confidence rather than stage.
- A forecast should state booked plus commit, the best case and the main risks, and can be adjusted using historical close rates by category.
- Optimism and sandbagging are common biases; leaders should judge forecasts on accuracy over time and track each seller's bias.
- Retail leaders review open quotes and forecast months using seasonal patterns rather than simple run rates.
- Pipeline review
- A working session between a manager and a seller about the seller's open opportunities.
- Forecast call
- A meeting in which sales leaders commit to a prediction of results for a period.
- Exit criteria
- Customer actions required before a deal can move to the next stage.
- Commit
- A forecast category for deals the team expects to close in the period.
- Best case
- A forecast category for deals that could close in the period if things go well.
- Forecast bias
- A consistent tendency for forecasts to be too high or too low.
Practice problems
Work each problem on paper first, then reveal the answer to check.
Booked 300,000 dollars, commit 120,000, best case 80,000. What are the commit and best-case forecasts?
Show answer
Commit forecast 300,000 + 120,000 = 420,000 dollars; best case 420,000 + 80,000 = 500,000 dollars.
A seller's forecasts were 100,000 and 90,000; results were 95,000 and 80,000. What is the average error?
Show answer
Errors 5,000 and 10,000; average 7,500 dollars too high.
By day 10 of a 30-day month a store has sold 200,000 dollars, and usually reaches 25 in 100 of the month by day 10. What is the seasonal forecast?
Show answer
200,000 ÷ 0.25 = 800,000 dollars.
Lesson quiz · 5 questions
Score 60% or more to complete this lesson.
Create a free account to save your progress, take quizzes and earn a certificate.