
SLS-251 · Lesson 1 of 12 · 22 min
How shoppers move through a store
▶ Video coming soon A video version of this lesson is on the way.
On Saturday, October 3, 2026, Noura Saleh handed Aiden Laroque a clipboard, a floor plan and a hand counter, and walked him to a spot just inside Juniper & Pine's main entrance. "For the next three hours," she said, "you are not a salesperson. You are a researcher. Every time a group comes through the door, make a mark where they go first, and later, how far they get." Aiden was still working in décor and small furniture then, two weeks before he moved to the main floor. Noura is the store's visual merchandising lead. She has dressed its windows, built its displays and planned its seasonal resets for eleven years, and she starts every new associate who helps her the same way: by watching shoppers before touching a single fixture.
This course is about the store itself as a selling tool. SLS-250 taught how associates sell on the floor. Visual merchandising is the work that happens before any conversation: where products go, how they are grouped and shown, how the store is lit and signed, and how a shopper is led from the front door to the back wall without feeling pushed. Done well, it brings shoppers to the products they came for and introduces them to things they did not know they wanted. Done badly, it hides the best products, confuses people and sends them out the door after three minutes. Every lesson in this course follows Noura's Tuesday-morning "merch walks" with Aiden through the fall of 2026, from the October traffic study to the holiday reset in November.
Why movement comes first
Merchandising decisions only make sense once you know how people actually move through the space. A beautiful display in a corner nobody visits sells nothing. A clearance table at the entrance may sell well but can make a whole store feel cheap. The first question a visual merchandiser asks is not "what looks good?" but "where do people walk, where do they stop, and what do they see when they stop?"
Researchers have studied shopper movement for decades, by watching, by filming and, more recently, with sensors, tags on shopping carts and phone signals. Paco Underhill's book *Why We Buy* (1999, revised 2009) made this research popular by describing what his firm learned from thousands of hours of video of shoppers. Academic studies, such as Larson, Bradlow and Fader's 2005 analysis of supermarket shopping paths recorded with tags on carts, added careful measurement. The findings below are useful starting points. None of them is a law of nature, and the only way to know how shoppers move in a particular store is to watch them there, as Aiden did.
The transition zone
Underhill observed that people who walk into a store need a few steps to slow down and adjust: to the light, the temperature, the noise and the sense of being inside. He called this space just inside the door the decompression zone or transition zone. Shoppers moving through it tend to miss what is right in front of them. Signs, small displays and handouts placed in the first few steps often go unseen.
The practical lesson is to keep the first several feet inside the door open and calm, and to put the first important display a little farther in, where shoppers have slowed down. At Juniper & Pine the first display is about 16 feet in from the main doors, on a low platform that shoppers can see over.
How big the zone is depends on the store. A small boutique may have one or two steps of transition; a large-format store entered from a big parking lot may need more. The idea is useful, but the size of the zone is an estimate, not a measured constant.
Turning right, or not
Underhill and many retail designers since have reported that most shoppers in North America drift to the right after entering and move around the store in a counterclockwise loop. Retail writers call this the "invariant right". It is one reason many stores put a strong display, sometimes called a power wall, on the right-hand wall just past the entrance.
The evidence for the invariant right is weaker than its fame suggests. Underhill's observations came from his firm's client studies, which were not published with their methods and numbers. Cart-tracking studies in supermarkets found that path direction followed the layout and the location of key departments as much as any natural tendency, and that shoppers on short trips broke from the usual route most often. Some stores deliberately send shoppers left, and it works for them. Explanations such as driving on the right have not been tested. The safest reading is that many shoppers drift right when nothing else pulls them, and that layout, sightlines and the location of the products they came for can easily override it.
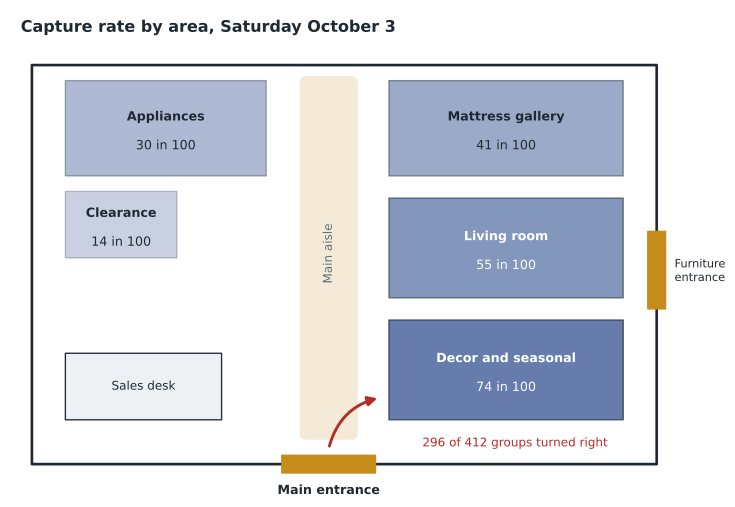
Noura's own count showed both sides of this. Of the 412 groups Aiden recorded coming through the main door that Saturday, 296 turned right first. That is a clear majority, but not everyone: shoppers who had come for appliances, which are at the back left, mostly turned left and walked straight there.
Worked problem
How many turned right?
Aiden counted 412 groups entering through the main door between 11 a.m. and 2 p.m. Of these, 296 turned right first, 71 turned left first and the rest walked straight ahead. What share turned right, and how many walked straight ahead?
Show solution
- Share turning right:
- \[296 \div 412 \approx 0.718\]
- That is about 72 in 100 groups.
- Groups walking straight ahead:
- \[412 - 296 - 71 = 45\]
Answer: About 72 in 100 groups turned right first, and 45 groups walked straight ahead. The right turn is common in this store, but almost 3 in 10 groups did something else, so the left side of the store cannot be treated as dead space.
Paths, loops and the back wall
Once inside, shoppers tend to follow the main aisle, the widest and clearest path through the store. In a large furniture store this is often a loop, sometimes called a racetrack, that carries people past every department and back to the front. Studies of shopping paths show that most shoppers do not walk every aisle. They follow the main path, make short trips into departments that interest them, and return to the path. Departments that are not visible from the main aisle get far fewer visits.
Stores use this in two ways. First, they put destination categories, the products many shoppers come specifically to buy, toward the back, so that shoppers pass other departments on the way. Supermarkets famously put milk and eggs at the back. At Juniper & Pine the mattress gallery and the appliance department are at the back of the store. Second, they place eye-catching displays at the points where the main aisle turns, because shoppers look ahead along the aisle and see what is at the end of each straight run.
This strategy has limits. Shoppers who come for one thing and cannot find it quickly become frustrated, and a store that feels like a maze damages trust. Good layouts lead shoppers past other products while keeping destinations clearly signed and easy to reach.
Capture rate: measuring how far shoppers get
The simplest way to measure movement is the capture rate of each area: the number of shopping groups who enter that area divided by the number who enter the store. Aiden's second job that Saturday was to stand at the edge of three departments for an hour each and count how many groups entered. Noura then combined his counts with the door count for the same hours.
| Area | Location | Groups entering area (estimated for the 3 hours) | Capture rate (of 412 groups) |
|---|---|---|---|
| Décor and seasonal | Front right | 305 | about 74 in 100 |
| Living room furniture | Center right | 226 | about 55 in 100 |
| Mattress gallery | Back right | 167 | about 41 in 100 |
| Appliances | Back left | 124 | about 30 in 100 |
| Clearance corner | Back left corner | 58 | about 14 in 100 |
The capture rates told Noura several things at once. Décor at the front right caught almost three quarters of all shoppers, which matched the right turn. The mattress gallery, a destination at the back, still drew about four in ten groups. The clearance corner, tucked behind appliances, was barely visited, which meant clearance items stayed there long after they should have sold.
Worked problem
Capture rate for the mattress gallery
During the hour Aiden stood at the mattress gallery, 58 groups entered it, while the door count for the same hour was 143. What was the capture rate for that hour, and how does it compare with the three-hour estimate of 167 of 412?
Show solution
- Capture rate for the hour:
- \[58 \div 143 \approx 0.406\]
- Three-hour estimate:
- \[167 \div 412 \approx 0.405\]
Answer: Both work out to about 41 in 100. The one-hour sample was close to the three-hour estimate, which gives Noura some confidence the count is representative for a Saturday midday. A weekday count would likely differ.
Where shoppers look and stop
Movement is only half the picture. The other half is where shoppers slow down, look and touch. Underhill reported several patterns that most visual merchandisers now take for granted.
Shoppers notice what is at and slightly below eye level far more than what is high or low. They look ahead along an aisle rather than sideways, so products facing the aisle get more attention than products set side-on. They slow down where there is something to touch, sit on or try. And they dislike being crowded: Underhill described the butt-brush effect, in which shoppers, particularly women in his studies, moved away from a display when other people brushed past them from behind in a narrow aisle. Wider aisles around displays that ask people to stop are a direct answer to that finding.
These patterns come from observation rather than controlled experiments, and some have not been tested formally. They are still useful, because each can be checked cheaply in a particular store. Noura's rule is that any idea from a book becomes a hypothesis to test on her own floor.
Ways to watch shoppers
| Method | What it shows | Limits |
|---|---|---|
| Door counters | How many people enter, by hour and day | No information on where they go; groups and individuals are hard to separate |
| Staff observation with a floor map | First turns, paths, stops and capture rates | Takes staff time; small samples; observers can be noticed |
| Video review | Detailed behavior at displays and fixtures | Privacy rules and signage; slow to analyze |
| Sensors and heat maps | Dwell time and paths across the whole floor | Cost; accuracy varies; privacy obligations for any personal data |
| Sales data by area | What sold where and when | Shows results, not why; ignores shoppers who did not buy |
Any method that records identifiable people raises privacy questions. South Dakota has no comprehensive consumer privacy law, but the FTC expects stores to keep their privacy promises and protect any data they collect, and clear signs at the entrances are standard practice where video is used. Counting groups on a clipboard, as Aiden did, collects no personal information at all.
What Noura changed
The traffic study led to three changes in October. First, Noura moved the clearance corner from behind appliances to a visible spot on the main loop near the mattress gallery, with a clear sign. Second, because almost three in ten shoppers turned left, she added a feature display on the left side, facing the entrance, so that left-turners saw something worth stopping for. Third, she moved a rack of small décor items out of the first few steps inside the door, where Aiden's observation showed almost nobody stopped. Later lessons measure whether those changes worked.
Common mistakes
MistakePut the most important sign right inside the door.
InsteadShoppers in the transition zone often miss it. Place key messages a few steps in, where they have slowed down.
MistakeEveryone turns right, so the left side does not matter.
InsteadMany shoppers drift right, but a large share do not, and layout and destinations can change direction. Count in your own store.
MistakeA department at the back is out of sight and out of mind.
InsteadDestinations at the back draw shoppers past other departments, if the route is clear and well signed.
MistakeTraffic is measured by sales.
InsteadSales show what sold, not how many shoppers reached an area. Capture rate measures reach.
MistakeA retail book's findings apply to every store.
InsteadTreat them as hypotheses and test them on your own floor.
Summary and key terms
- Visual merchandising uses the store itself to lead shoppers to products and help them buy.
- Shoppers need a few steps to adjust after entering; important displays work better just past this transition zone.
- Many shoppers drift right and follow the main aisle, but layout, sightlines and destinations can override this, so stores count for themselves.
- Destination categories placed toward the back draw shoppers past other departments, as long as the route is clear.
- Capture rate, the share of store shoppers who enter an area, is a simple measure of reach.
- Shoppers notice what is at eye level and ahead of them, stop where they can touch and try, and avoid crowded displays.
- Transition zone
- The first few steps inside a store, where shoppers adjust and tend to miss displays and signs.
- Invariant right
- The reported tendency of shoppers in North America to turn right after entering and move counterclockwise.
- Power wall
- A strong display wall placed where most shoppers look first, often on the right just past the entrance.
- Destination category
- A product category many shoppers come specifically to buy.
- Capture rate
- The number of shopping groups entering an area divided by the number entering the store.
- Butt-brush effect
- Underhill's observation that shoppers move away from displays when people brush past them from behind.
Practice problems
Work each problem on paper first, then reveal the answer to check.
In one hour, 120 groups enter a store and 30 of them enter the lighting department. What is the department's capture rate?
Show answer
30 divided by 120 is 0.25, or 25 in 100.
Why might shoppers miss a sign placed right inside the door?
Show answer
They are still in the transition zone, adjusting to the space, and tend to look past what is immediately in front of them.
A store puts its best-selling category at the very front. What does it risk losing?
Show answer
The chance to draw shoppers past other departments on their way to the destination category.
Give one limit of studying shoppers with video.
Show answer
Privacy obligations and signage, plus the time it takes to review and analyze the footage.
Lesson quiz · 5 questions
Score 60% or more to complete this lesson.
Create a free account to save your progress, take quizzes and earn a certificate.