
STAT-235 · Lesson 2 of 12 · 30 min
Collecting data: sampling, measurement and experimental design
Lesson 1 showed how to summarize data once you have it. The quality of any statistical conclusion, however, is decided earlier: by how the data were collected. A sample chosen for convenience can be biased in ways no calculation can repair; a gauge that cannot tell good parts from bad makes every later test meaningless; and an experiment that changes two things at once cannot say which one mattered. This lesson covers the decisions an engineer makes before the first number is recorded. It compares the main sampling methods and the biases that creep into samples, explains how to judge a measurement system by its accuracy, precision, repeatability and reproducibility, distinguishes observational studies from experiments, and sets out the principles of experimental design (control, randomization, replication and blocking) that the analysis methods of Lessons 8 and 9 rely on. It ends with practical rules for recording and cleaning data.
Why the collection method matters
Statistics can quantify random error, the scatter that comes from chance, and shrink it by taking larger samples. It cannot detect or remove systematic error, or bias, which pushes every result the same way. A sample of 1000 biased measurements gives a very precise estimate of the wrong value. The classic engineering examples are mundane: testing only the concrete trucks that arrived on time, inspecting only the parts at the top of a bin, surveying only the customers who answered the phone, or taking water samples only on dry days. Each produces a sample that differs systematically from the population it is meant to represent.
Sampling methods
The aim of sampling is a sample whose composition mirrors the population, chosen so that the uncertainty of the estimates can be calculated. Four methods cover most engineering situations:
- Simple random sampling: every possible sample of size n is equally likely. Number the items and use random numbers to pick them. It is the basis of most statistical formulas.
- Stratified sampling: divide the population into groups (strata) that differ from one another, such as suppliers, shifts or production lines, and take a random sample from each, usually in proportion to its size. It guarantees that every group is represented and, when groups differ, gives more precise estimates than a simple random sample of the same size.
- Systematic sampling: take every kth item from a sequence, such as every 50th part off a line or a core every 100 m along a road, starting at a random point. It is easy to carry out and spreads the sample evenly, but it can be badly misled if the process has a cycle that matches k.
- Cluster sampling: pick a few groups at random and measure everything in them, such as all the bolts in three randomly chosen boxes. It is cheap when travel or handling is the main cost, but items within a cluster tend to be alike, so it is less precise than its sample size suggests.

Worked problem
Stratifying a bolt lot
A lot of 3000 bolts comes from three suppliers: 1500 from A (mean strength about 830 MPa), 1000 from B (about 860 MPa) and 500 from C (about 900 MPa). Compare a simple random sample of 30 bolts with a stratified sample of 15, 10 and 5, and with simply taking the first 30 bolts off the pile.
Show solution
- Both random methods are unbiased: on average they estimate the lot mean correctly.
- The stratified sample removes the variation caused by how many bolts from each supplier happen to be chosen, so its estimate scatters less.
- The first 30 bolts all come from supplier A, which was unloaded last.
Answer: The simulation below shows the stratified estimate is about two and a half times less variable than the simple random one for the same 30 tests, while the convenience sample is 21 MPa low: a large bias that no sample-size formula would reveal.
import numpy as np

rng = np.random.default_rng(42)
# A lot of 3000 bolts from three suppliers with different mean tensile strengths (MPa)
sizes, means = [1500, 1000, 500], [830, 860, 900]
lot = np.concatenate([rng.normal(m, 12, n) for m, n in zip(means, sizes)])
supplier = np.repeat([0, 1, 2], sizes)
true_mean = lot.mean()

srs, strat = [], []
for _ in range(10000):
    srs.append(rng.choice(lot, 30, replace=False).mean())
    # stratified: 15, 10 and 5 bolts, in proportion to each supplier share
    parts = [rng.choice(lot[supplier == s], k, replace=False) for s, k in zip(range(3), [15, 10, 5])]
    strat.append(np.concatenate(parts).mean())

print(f"True lot mean: {true_mean:.1f} MPa")
print(f"Simple random samples of 30: mean {np.mean(srs):.1f}, spread (SD) {np.std(srs):.2f} MPa")
print(f"Stratified samples of 30:    mean {np.mean(strat):.1f}, spread (SD) {np.std(strat):.2f} MPa")
first = lot[:30].mean()
print(f"First 30 bolts off the pile (all from one supplier): {first:.1f} MPa")True lot mean: 851.4 MPa Simple random samples of 30: mean 851.4, spread (SD) 5.21 MPa Stratified samples of 30: mean 851.3, spread (SD) 2.16 MPa First 30 bolts off the pile (all from one supplier): 830.2 MPa
Sources of bias
Even with a good sampling plan, bias can enter in several ways, and recognizing them is half of preventing them:
- Selection bias: the way items are chosen favors some over others, as with convenience samples or volunteers.
- Non-response or missing-data bias: some selected items are never measured, and the missing ones differ from the rest. Specimens that broke during handling, survey forms not returned, and sensors that fail in extreme conditions are all examples.
- Measurement bias: the instrument or procedure reads consistently high or low, for example an uncalibrated load cell or a technician who rounds readings toward a target.
- Survivorship bias: only items that survived some process are observed. Studying the bridges still standing tells you little about why others failed.
Writing down how each sample was chosen, and who chose it, is the simplest defense: it lets a reviewer spot problems that the person collecting the data did not.
Measurement systems
Every measurement is the true value plus error. Two properties describe a measurement system. Accuracy (or trueness) is how close the average reading is to the true value; its opposite is bias, which is found and corrected by calibration against a reference standard. Precision is how close repeated readings are to each other, measured by their standard deviation. A gauge can be precise but inaccurate (tightly grouped readings in the wrong place) or accurate but imprecise (centered but scattered).
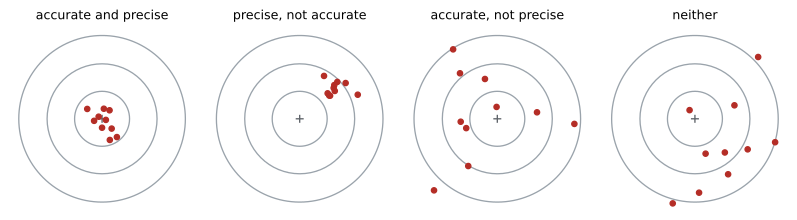
Precision is often split further. Repeatability is the variation when the same operator measures the same part repeatedly with the same gauge; reproducibility is the extra variation between operators, labs or set-ups. A gauge repeatability and reproducibility (gauge R&R) study, in which several operators measure several parts several times, estimates both, using the analysis of variance of Lesson 9. A common rule of thumb compares the measurement standard deviation with the tolerance: if the measurement system uses up more than about 30% of the tolerance, it cannot reliably separate good parts from bad.
Resolution matters too. A gauge should read to about one tenth of the tolerance or of the process spread; a caliper reading to 0.1 mm cannot police a tolerance of ±0.05 mm.
Worked problem
Is the gauge good enough?
A shaft diameter has a tolerance of 25.00 ± 0.05 mm. A gauge study gives a measurement standard deviation of 0.006 mm. Using the common 6σ spread, what fraction of the tolerance does the measurement system consume?
Show solution
- Measurement spread: \(6\sigma = 0.036\) mm.
- Tolerance width: 0.10 mm.
- Ratio: 0.036/0.10 = 36%.
Answer: About 36%, more than the usual 30% limit, so the gauge is marginal: parts near the tolerance limits will often be misjudged. Improving the fixture or using a better instrument should come before any capability study of the process (Lesson 11).
Observational studies and experiments
In an observational study, the engineer records what happens without intervening: the pavement condition on roads with different traffic, the failure rates of pumps in different plants. In an experiment, the engineer deliberately sets the conditions, such as the curing temperature of concrete or the cutting speed of a tool, and observes the response. Only experiments can establish cause and effect convincingly.
The reason is confounding. In observational data, the factor of interest is often tangled with others. Roads with heavy traffic may also be older and in wetter areas; pumps in one plant may also run harder and get less maintenance. A difference in outcomes cannot then be attributed to any one factor. Observational studies are still valuable, often the only option for large or historical systems, but their conclusions about causes must be cautious, and they should record as many potential confounding variables as possible so that the analysis can account for them (for example with the multiple regression of Lesson 10).
Principles of experimental design
A well-designed experiment answers its question with the fewest runs and with conclusions that can be trusted. Four principles do most of the work:
- Control: hold everything constant except the factors being studied, and include a baseline or control condition for comparison.
- Randomization: assign treatments to experimental units, and decide the run order, at random. This spreads the effects of unknown or uncontrollable variables (drifting room temperature, a tiring operator, a gradually wearing tool) evenly across treatments, so they cannot masquerade as treatment effects.
- Replication: run each treatment on several independent units. Replication measures the natural variation, without which no test of significance is possible, and reduces the uncertainty of each treatment mean. Measuring the same specimen three times is repeated measurement, not replication.
- Blocking: when units come in groups known to differ, such as batches of material, days or machines, compare treatments within each group. Differences between blocks then drop out of the comparison, as in the paired t-test of Lesson 7.
Worked problem
Designing a curing experiment
A lab wants to compare three curing methods for concrete cylinders. Cement deliveries vary from day to day, and the lab can cast and test 12 cylinders from each day's batch. Design the experiment.
Show solution
- Treat each day's batch as a block, since batches differ.
- Within each batch, assign 4 cylinders to each curing method at random (replication and randomization).
- Test the cylinders in random order, so that drift in the testing machine does not favor one method.
- Repeat over at least three days to see whether the method differences are consistent.
Answer: A randomized block design with batches as blocks and 4 replicates per method per batch. The two-way analysis of variance of Lesson 9 then separates the curing effect from batch-to-batch variation, a comparison far more sensitive than mixing all batches together.
When several factors may matter, changing one factor at a time is inefficient and misses interactions, cases where the effect of one factor depends on the level of another. Factorial designs, which vary all factors together in a planned pattern, are the subject of Lesson 9.
Recording and cleaning data
Good data management prevents many errors. Record raw measurements, not just summaries, together with units, dates, instrument identifiers, operators and any unusual conditions. Keep the original record unchanged and do any cleaning in a copy, with each change documented. Check for impossible values (negative lengths, strengths ten times typical), duplicated entries, unit mix-ups and transcription errors. Investigate outliers (Lesson 1) rather than deleting them: an outlier may be a recording mistake, but it may also be the most important observation in the data set, such as the first sign of a process going wrong. Removing inconvenient points to obtain a desired result is scientific misconduct, and in safety-critical work it can be dangerous.
Common mistakes
MistakeAssuming a large sample cures a biased collection method.
InsteadLarger samples reduce random error only; fix bias by changing how data are collected.
MistakeUsing a convenience sample, such as the first items off the line.
InsteadUse random, stratified or properly started systematic sampling.
MistakeTreating repeated measurements of one specimen as replicates.
InsteadReplication means independent experimental units.
MistakeRunning treatments in a fixed order.
InsteadRandomize the run order to protect against drift and unknown influences.
MistakeConcluding cause and effect from an observational study.
InsteadConsider confounding variables; experiments give stronger evidence of causation.
MistakeDeleting outliers without investigation.
InsteadFind out why they occurred and document any change to the data.
Summary and key terms
- Bias cannot be removed by statistics or larger samples; it must be prevented by good collection methods.
- Simple random, stratified, systematic and cluster sampling suit different situations; stratification improves precision when groups differ.
- Selection, non-response, measurement and survivorship bias are common traps.
- Accuracy is closeness to the true value; precision is closeness of repeated readings.
- Gauge R&R separates repeatability and reproducibility; the measurement system should use well under 30% of the tolerance.
- Experiments can establish causation; observational studies are vulnerable to confounding.
- Control, randomization, replication and blocking are the principles of experimental design.
- Bias
- Systematic error that shifts results consistently in one direction.
- Simple random sample
- A sample in which every possible set of n items is equally likely.
- Stratified sampling
- Random sampling within groups that differ from one another.
- Systematic sampling
- Selecting every kth item from a random starting point.
- Cluster sampling
- Randomly selecting whole groups and measuring every item in them.
- Accuracy
- Closeness of the average measurement to the true value.
- Precision
- Closeness of repeated measurements to each other.
- Gauge R&R
- A study estimating the repeatability and reproducibility of a measurement system.
- Confounding
- Mixing of the effect of one factor with the effects of others.
- Randomization
- Assigning treatments and run order by chance.
- Replication
- Applying each treatment to several independent units.
- Blocking
- Comparing treatments within groups of similar units.
Practice problems
Work each problem on paper first, then reveal the answer to check.
An inspector checks the first 20 cartons loaded each morning. What kind of bias could result?
Show answer
Selection bias: early cartons may differ (fresh shift, first production) from the rest.
A plant has three shifts producing 50%, 30% and 20% of output. How would you allocate a stratified sample of 40?
Show answer
20, 12 and 8 items.
Why might systematic sampling of every 10th part fail on a 10-cavity mold?
Show answer
Every sampled part could come from the same cavity.
Readings of a 50.00 mm standard are 50.21, 50.20, 50.22, 50.21. Accurate? Precise?
Show answer
Precise but not accurate (bias about +0.21 mm).
A tolerance is ±0.2 mm and the gauge σ is 0.01 mm. What percentage of the tolerance does 6σ use?
Show answer
0.06/0.4 = 15%: acceptable.
What resolution should a gauge have for a tolerance of ±0.5 mm?
Show answer
About 0.1 mm or finer (one tenth of the 1.0 mm tolerance width).
Older bridges show more corrosion. Name a possible confounding variable.
Show answer
Exposure to de-icing salt, which also varies with age and location (or design standard of the era).
Three specimens are each tested twice. How many replicates are there?
Show answer
Three; the repeats are repeated measurements.
Why randomize the order of tests on a universal testing machine?
Show answer
So any drift in the machine or conditions does not line up with one treatment.
When should you use blocking?
Show answer
When experimental units fall into groups that differ, such as batches or days.
Lesson quiz · 5 questions
Score 60% or more to complete this lesson.
Create a free account to save your progress, take quizzes and earn a certificate.