
ACCT-101 · Lesson 9 of 12 · 28 min
Inventory costing: FIFO, weighted average and lower of cost and net realizable value
When a merchandiser buys identical goods at different prices, it must decide which cost goes to cost of goods sold when one unit is sold and which stays in inventory. That choice does not change how many units were sold or how much cash came in, but it changes reported gross profit, net income, the inventory figure on the balance sheet and, in some countries, income tax. This lesson explains the cost flow methods allowed under the standards, works them through for Birchwood Bikes' city bicycles, compares their effects when prices are rising, explains the lower of cost and net realizable value rule, shows how an inventory error carries through two years, and introduces methods for estimating inventory.
What goes into inventory cost
The cost of inventory includes all costs to bring the goods to their present location and condition: the purchase price net of discounts and returns, freight-in, import duties, and non-recoverable taxes. It excludes storage after the goods are ready for sale, selling costs and abnormal waste, which are expensed. Recoverable taxes, such as GST/HST for a Canadian registrant, are not part of cost. For a manufacturer, cost also includes materials, labour and an allocation of production overhead, a topic for ACCT-102 and ACCT-222.
The cost flow methods
Under IFRS (IAS 2) and ASPE (Section 3031), inventory costs are assigned by specific identification for items that are not ordinarily interchangeable, and otherwise by first-in, first-out (FIFO) or weighted average cost. The last-in, first-out (LIFO) method is prohibited. An entity uses the same method for inventories of a similar nature and use, and applies it consistently. You will still meet LIFO when reading the statements of US companies, so it is explained briefly at the end of this section.
Specific identification tracks the actual cost of each unit sold. It suits expensive, distinguishable items such as cars, jewellery, custom bicycles and real estate, and is required for items not ordinarily interchangeable. For large numbers of identical items it is impractical and could be used to manipulate profit by choosing which unit to 'sell'.
FIFO assumes the oldest units are sold first, so cost of goods sold reflects older costs and ending inventory reflects the most recent costs. That matches the physical flow of most goods, especially perishables. Weighted average assigns every unit the average cost of the goods available. Under a periodic system, one average is computed for the whole period. Under a perpetual system, a new moving average is computed after each purchase.
LIFO, used only under US GAAP, assumes the newest units are sold first, so cost of goods sold reflects the most recent costs and ending inventory may include very old costs. When prices rise, LIFO gives higher cost of goods sold and lower taxable income. Because the US tax code requires a company using LIFO for tax to use it in its financial statements too (the LIFO conformity rule), some US companies report on LIFO. Canadian tax law does not allow LIFO, which is one reason IFRS and ASPE prohibit it without much controversy in Canada.
A worked example
Birchwood Bikes sells one model of city bicycle. In July it had the following activity. Under a periodic system, the count at 31 July shows 14 bicycles on hand.
| Date | Event | Units | Unit cost | Total cost |
|---|---|---|---|---|
| 1 July | Beginning inventory | 10 | $400 | $4,000 |
| 8 July | Purchase | 20 | $410 | $8,200 |
| 18 July | Purchase | 15 | $425 | $6,375 |
| 26 July | Purchase | 5 | $440 | $2,200 |
| Goods available for sale | 50 | $20,775 | ||
| Units sold in July (at $650) | 36 | |||
| 31 July | Ending inventory (count) | 14 |
Goods available for sale cost $20,775, and that total must be split between cost of goods sold (36 units) and ending inventory (14 units). Each method splits it differently.
# Periodic FIFO, weighted average and LIFO for July (illustrative)
layers = [(10, 400), (20, 410), (15, 425), (5, 440)]   # oldest first
sold, price = 36, 650
units = sum(u for u, _ in layers)
cost_available = sum(u * c for u, c in layers)

def cost_of(n, ordered):
    total = 0
    for u, c in ordered:
        take = min(u, n)
        total += take * c
        n -= take
        if n == 0:
            break
    return total

fifo_cogs = cost_of(sold, layers)
lifo_cogs = cost_of(sold, list(reversed(layers)))
avg = cost_available / units
avg_cogs = round(avg * sold, 2)

print(f"Goods available {units} units, cost {cost_available:,}")
for name, cogs in (("FIFO", fifo_cogs), ("Weighted average", avg_cogs), ("LIFO (US only)", lifo_cogs)):
    ending = cost_available - cogs
    gp = sold * price - cogs
print(f"{name:<17} COGS {cogs:>9,.2f} ending inventory {ending:>8,.2f} gross profit {gp:>9,.2f}")Goods available 50 units, cost 20,775 FIFO COGS 14,750.00 ending inventory 6,025.00 gross profit 8,650.00 Weighted average COGS 14,958.00 ending inventory 5,817.00 gross profit 8,442.00 LIFO (US only) COGS 15,135.00 ending inventory 5,640.00 gross profit 8,265.00
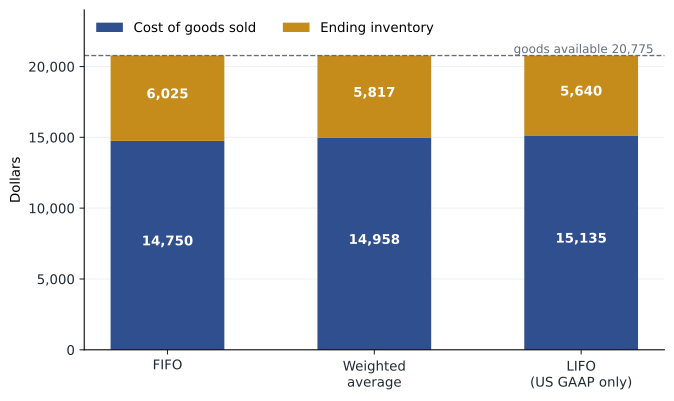
FIFO charges the 10 bicycles at $400, all 20 at $410 and 6 of the 15 at $425 to cost of goods sold, a total of $14,750, leaving the newest units ($425 × 9 + $440 × 5 = $6,025) in inventory. Weighted average uses $20,775 ÷ 50 = $415.50 for every unit: cost of goods sold $14,958 and ending inventory $5,817. LIFO charges the newest units first: cost of goods sold $15,135 and ending inventory $5,640. With rising prices, FIFO gives the lowest cost of goods sold and highest profit and inventory, LIFO the reverse, and weighted average falls between. When prices fall, the order flips.
| Method | COGS | Ending inventory | Gross profit (sales $23,400) |
|---|---|---|---|
| FIFO | $14,750 | $6,025 | $8,650 |
| Weighted average | $14,958 | $5,817 | $8,442 |
| LIFO (not permitted under IFRS or ASPE) | $15,135 | $5,640 | $8,265 |
Perpetual FIFO and moving average
Under a perpetual system, costs are assigned at the moment of each sale. FIFO gives exactly the same results under periodic and perpetual systems, because the oldest units are always the first ones out. Weighted average differs: the perpetual moving average is recomputed after each purchase, so sales early in the month use a lower average than sales later. Software handles this automatically, but it is worth working one example by hand.
Worked problem
Moving average
Use the July data. Suppose 12 bicycles were sold on 15 July and 24 on 28 July. Compute moving-average cost of goods sold.
Show solution
- After the 8 July purchase: 30 units, cost 4,000 + 8,200 = 12,200; average 406.67.
- 15 July sale of 12: COGS 12 × 406.67 = 4,880.00; left 18 units costing 7,320.
- 18 July purchase: 33 units, cost 7,320 + 6,375 = 13,695; average 415.00. 26 July purchase: 38 units, cost 15,895; average 418.29.
- 28 July sale of 24: COGS 24 × 418.29 = 10,038.95; left 14 units costing 5,856.05.
- Total COGS = 4,880.00 + 10,038.95 = 14,918.95.
Answer: Moving-average COGS is about $14,919 and ending inventory about $5,856, close to but not equal to the periodic average.
Lower of cost and net realizable value
Inventory must not be carried above the amount the business expects to get for it. Net realizable value (NRV) is the estimated selling price in the ordinary course of business less the estimated costs of completion and sale. If NRV falls below cost, because goods are damaged, obsolete or selling prices have dropped, inventory is written down to NRV and the loss is recognized in cost of goods sold (or a separate line) in the period of the decline. The write-down is usually done item by item or for groups of similar items.
Under IFRS and ASPE, if the circumstances that caused a write-down reverse, for example selling prices recover, the write-down is reversed, but never above original cost.
Worked problem
An NRV write-down
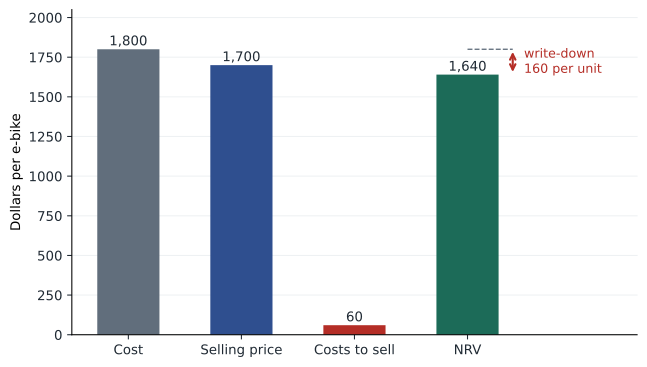
At year end, Birchwood has six last-season e-bikes that cost $1,800 each. They can now be sold for $1,700 each, and selling them requires a $60 battery service per bike.
Show solution
- NRV per bike = 1,700 − 60 = $1,640.
- Cost 1,800 exceeds NRV 1,640 by $160 per bike; total write-down = 6 × 160 = $960.
- Entry: debit Cost of goods sold (inventory write-down) 960; credit Inventory 960.
- The e-bikes are carried at 6 × 1,640 = $9,840.
Answer: Write inventory down by $960 to $9,840.
Inventory errors
Because ending inventory of one year is beginning inventory of the next, an error in counting or costing inventory affects two years. If ending inventory is overstated, cost of goods sold is understated and net income is overstated in that year. Next year, beginning inventory is overstated, so cost of goods sold is overstated and net income is understated by the same amount. Over the two years combined, total net income is correct, and by the end of the second year retained earnings is correct, but each year's results are wrong. That self-correcting pattern does not excuse the error: users compare years, and lenders may lend on the strength of an overstated year.
| Effect of overstating ending inventory by $2,000 | Year 1 | Year 2 |
|---|---|---|
| Cost of goods sold | Understated $2,000 | Overstated $2,000 |
| Net income | Overstated $2,000 | Understated $2,000 |
| Ending retained earnings | Overstated $2,000 | Correct |
| Ending inventory | Overstated $2,000 | Correct (if year 2 count is right) |
Estimating inventory
Businesses sometimes need an inventory figure without counting: for monthly statements, after a fire or theft for an insurance claim, or to test whether a count is reasonable. The gross profit method estimates cost of goods sold from sales and the normal gross margin. The retail method, used by department stores, keeps records at both cost and retail prices and applies the cost-to-retail ratio to ending inventory at retail.
Worked problem
Gross profit method after a fire
A flood destroys a shop's stockroom on 20 March. Beginning inventory was $36,000, purchases since 1 January were $54,000, sales were $80,000, and the normal gross margin is 35 %. Estimate the inventory lost.
Show solution
- Goods available = 36,000 + 54,000 = 90,000.
- Estimated COGS = sales × (1 − gross margin) = 80,000 × 0.65 = 52,000.
- Estimated ending inventory = 90,000 − 52,000 = 38,000.
Answer: Estimated inventory at the date of the flood is $38,000, less any goods salvaged.
Inventory turnover, cost of goods sold divided by average inventory, and its companion, days' sales in inventory, show how quickly stock sells. Lesson 12 uses them. The choice of cost flow method affects these ratios, so analysts check which method a company uses before comparing it with another.
Common mistakes
MistakeUsing LIFO in Canadian financial statements.
InsteadIFRS and ASPE prohibit LIFO; use specific identification, FIFO or weighted average.
MistakeThinking the cost flow method must match the physical flow of goods.
InsteadThe method is an accounting assumption; FIFO often matches physical flow but it is not required to.
MistakeIncluding storage or selling costs in inventory.
InsteadInventory cost covers bringing goods to their location and condition; later storage and selling costs are expensed.
MistakeAssuming an inventory error corrects itself so it does not matter.
InsteadEach year's income is wrong, and users rely on year-by-year results.
MistakeWriting inventory down to selling price instead of NRV.
InsteadDeduct the costs to complete and sell from the expected selling price.
Summary and key terms
- Inventory cost includes all costs to bring goods to their present location and condition.
- IFRS and ASPE allow specific identification, FIFO and weighted average; LIFO is prohibited.
- With rising prices, FIFO gives lower COGS and higher income and inventory; LIFO the opposite; average falls between.
- FIFO gives the same results under periodic and perpetual systems; weighted average does not.
- Inventory is written down when net realizable value falls below cost.
- An inventory error misstates income in two consecutive years in opposite directions.
- The gross profit and retail methods estimate inventory without a count.
- Specific identification
- A method that assigns the actual cost of each specific unit sold.
- First-in, first-out (FIFO)
- A method that assumes the oldest units are sold first.
- Weighted average cost
- A method that assigns each unit the average cost of goods available.
- Moving average
- A perpetual weighted-average method that recalculates the average after each purchase.
- Last-in, first-out (LIFO)
- A method that assumes the newest units are sold first; prohibited under IFRS and ASPE.
- Goods available for sale
- Beginning inventory plus net purchases for the period.
- Net realizable value (NRV)
- Estimated selling price less estimated costs of completion and sale.
- Inventory write-down
- A reduction of inventory to net realizable value, recognized as an expense.
- Gross profit method
- An estimate of ending inventory using sales and the normal gross margin.
- Retail method
- An estimate of ending inventory using the ratio of cost to retail prices.
Practice problems
Work each problem on paper first, then reveal the answer to check.
Beginning inventory 100 units at $5; purchases 200 at $6 and 100 at $7; 300 units sold. Find FIFO COGS.
Show answer
100 × 5 + 200 × 6 = $1,700.
Same data: find periodic weighted-average COGS.
Show answer
Average = (500 + 1,200 + 700) ÷ 400 = $6.00; COGS = 300 × 6 = $1,800.
Same data: what would LIFO COGS be, and could a Canadian company use it?
Show answer
100 × 7 + 200 × 6 = $1,900; no, LIFO is prohibited under IFRS and ASPE.
When prices are falling, which method gives the highest gross profit?
Show answer
Weighted average gives a higher gross profit than FIFO when prices fall (FIFO charges the older, higher costs).
An item cost $250; it can be sold for $240 with $20 selling costs. At what amount is it carried?
Show answer
NRV = $220.
Ending inventory in year 1 was understated by $3,000. Effects on year 1 and year 2 net income?
Show answer
Year 1 understated $3,000; year 2 overstated $3,000.
Sales are $120,000, gross margin 40 %, beginning inventory $25,000, purchases $70,000. Estimate ending inventory.
Show answer
25,000 + 70,000 − 72,000 = $23,000.
Why might a US company prefer LIFO when prices rise?
Show answer
Higher COGS lowers taxable income; the LIFO conformity rule requires using it in the financial statements too.
Which costs are included in inventory: freight-in, warehouse rent after goods are ready, import duty, advertising?
Show answer
Freight-in and import duty; not warehouse rent after readiness or advertising.
Change the layers in the Python program so prices fall (440, 425, 410, 400). Which method now gives the highest gross profit?
Show answer
Weighted average beats FIFO; LIFO would give the highest, but it is not allowed in Canada.
Lesson quiz · 5 questions
Score 60% or more to complete this lesson.
Create a free account to save your progress, take quizzes and earn a certificate.