
CMPUT-367 · Lesson 7 of 12 · 35 min
Ensembles: bagging, random forests and boosting
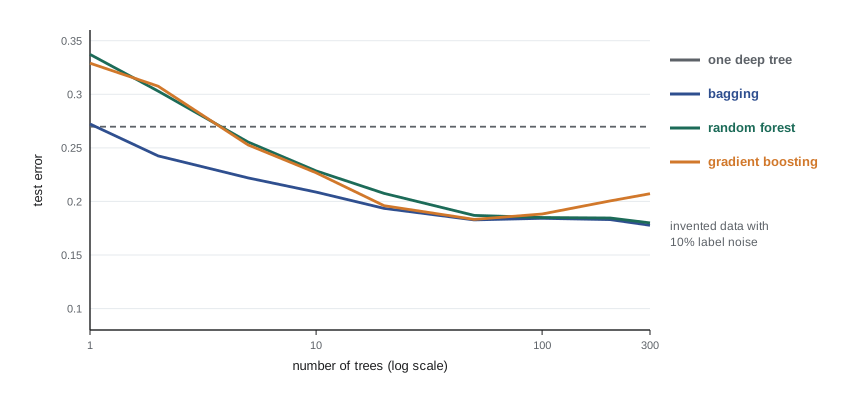
An ensemble combines the predictions of many models into one. The idea sounds like hedging, but it is one of the most powerful in machine learning: random forests and gradient-boosted trees are, for tabular data such as customer records, sensor logs and financial transactions, usually the most accurate off-the-shelf methods, and they regularly beat deep neural networks on such data. This lesson explains the two great families. Bagging and random forests average many high-variance models to cancel their errors. Boosting builds a sequence of weak models, each correcting its predecessors, to drive down bias. Both are most often applied to the decision trees of lesson 6.
Why averaging helps
Suppose we have B models whose errors on a given input are random variables with variance \(\sigma^2\) and pairwise correlation \(\rho\). The variance of their average is
As B grows, the second term vanishes, but the first does not: averaging removes the independent part of the errors and keeps the shared part. If the models were independent (\(\rho = 0\)), averaging B of them would divide the variance by B. If they were identical (\(\rho = 1\)), averaging would do nothing. Averaging leaves bias unchanged, because the average of the models has the same expected prediction as each one. So ensembles by averaging work best with models that have low bias, high variance and low correlation with each other. Unpruned decision trees fit that description perfectly: deep enough to have low bias, unstable enough to have high variance. The design problem is to make them as different from one another as possible.
Bagging
Leo Breiman's bagging (bootstrap aggregating, 1996) creates diversity by training each model on a different bootstrap sample: n examples drawn with replacement from the n training examples. Each bootstrap sample contains on average about 63.2 per cent of the distinct examples, since the chance a given example is never drawn is \((1 - 1/n)^n \to e^{-1} \approx 0.368\). For regression the ensemble averages the predictions; for classification it takes a majority vote or averages predicted probabilities.
# Bagging from scratch: averaging trees grown on bootstrap samples reduces variance.
import numpy as np
from sklearn.tree import DecisionTreeRegressor
rng = np.random.default_rng(367)
f = lambda x: np.sin(3 * x) + 0.5 * x
def sample(n):
    x = rng.uniform(-2, 2, (n, 1)); return x, f(x[:, 0]) + rng.normal(0, 0.4, n)
Xtr, ytr = sample(150); Xte, yte = sample(3000)

def bagged(X, y, B):
    trees = []
    for b in range(B):
        idx = rng.integers(0, len(y), len(y))          # bootstrap: n draws with replacement
        trees.append(DecisionTreeRegressor(random_state=b).fit(X[idx], y[idx]))
    return lambda Xq: np.mean([t.predict(Xq) for t in trees], axis=0)

single = DecisionTreeRegressor(random_state=0).fit(Xtr, ytr)
print(f"one unpruned tree:    test MSE {np.mean((single.predict(Xte) - yte) ** 2):.3f}")
for B in (5, 25, 100):
    print(f"bagging, B = {B:3}:    test MSE {np.mean((bagged(Xtr, ytr, B)(Xte) - yte) ** 2):.3f}")
print("noise variance (the floor): 0.160")
print(f"fraction of distinct examples in a bootstrap sample of 150: {np.unique(rng.integers(0, 150, 150)).size / 150:.3f}")one unpruned tree: test MSE 0.329 bagging, B = 5: test MSE 0.249 bagging, B = 25: test MSE 0.237 bagging, B = 100: test MSE 0.239 noise variance (the floor): 0.160 fraction of distinct examples in a bootstrap sample of 150: 0.680
A single unpruned tree has test error about twice the noise floor; bagging only 5 trees cuts the error by a quarter, 25 trees help a little more, and beyond that the error levels off, because the variance that remains is the part the trees share. Bagging rarely hurts: adding more trees does not cause overfitting in the way that adding depth does, because each new tree only refines an average. It helps little for stable, low-variance models such as linear regression, and it is most useful for exactly the models, like deep trees, that a statistician would call unreliable.
Bagging also offers a free validation set. Each example is left out of about 37 per cent of the bootstrap samples. Predicting each example using only the trees that did not see it gives the out-of-bag (OOB) error, an estimate of test error almost as good as cross-validation and obtained at no extra cost.
Random forests
Trees grown on bootstrap samples of the same data are still strongly correlated: if one feature is a strong predictor, nearly every tree will split on it at the root, and the trees will look alike. Breiman's random forests (2001) add a second source of randomness: at each split, only a random subset of m of the d features is considered. A common default is \(m \approx \sqrt{d}\) for classification and \(m \approx d/3\) for regression. Forcing trees to use different features decorrelates them, lowering \(\rho\) in the variance formula, and the forest's accuracy improves even though each individual tree is somewhat worse.
Random forests have few hyperparameters and are forgiving about their values: the number of trees (more is better, with diminishing returns), m, and the minimum leaf size. They need no feature scaling, handle mixed feature types, give OOB error estimates and are trivially parallel. These qualities make a random forest an excellent first model to try on a new tabular problem, and a strong baseline against which to judge more elaborate methods.
Feature importance
Forests are less interpretable than a single tree, but they offer measures of how much each feature matters. Impurity-based importance (mean decrease in impurity) adds up the impurity reduction from every split on a feature, across all trees. It is cheap but biased toward features with many distinct values, which offer many candidate thresholds and so can reduce training impurity by chance. Permutation importance measures how much a model's accuracy on held-out data drops when one feature's values are randomly shuffled, breaking its relationship with the target. It is more reliable, applies to any model, and should be computed on validation or test data rather than training data.
# A random forest with out-of-bag error and two kinds of feature importance.
import numpy as np
from sklearn.ensemble import RandomForestClassifier
from sklearn.inspection import permutation_importance
rng = np.random.default_rng(367)
# invented data: will a shipment arrive late? Only the first three features matter.
n = 1500
names = ["distance", "storm", "holiday", "weight", "box_id"]
X = np.column_stack([rng.uniform(0, 2000, n), rng.integers(0, 2, n), rng.integers(0, 2, n),
                     rng.uniform(1, 30, n), rng.integers(0, 100_000, n)])
logit = -3 + 0.0015 * X[:, 0] + 1.6 * X[:, 1] + 1.0 * X[:, 2]
y = (rng.uniform(size=n) < 1 / (1 + np.exp(-logit))).astype(int)
Xtr, ytr, Xte, yte = X[:1000], y[:1000], X[1000:], y[1000:]

rf = RandomForestClassifier(n_estimators=300, oob_score=True, random_state=0).fit(Xtr, ytr)
print(f"out-of-bag accuracy {rf.oob_score_:.3f}   test accuracy {rf.score(Xte, yte):.3f}")
perm = permutation_importance(rf, Xte, yte, n_repeats=20, random_state=0)
print("feature    impurity importance   permutation importance (test set)")
for i in np.argsort(-perm.importances_mean):
print(f"{names[i]:9} {rf.feature_importances_[i]:19.3f} {perm.importances_mean[i]:22.3f}")out-of-bag accuracy 0.669 test accuracy 0.664 feature impurity importance permutation importance (test set) distance 0.353 0.071 storm 0.121 0.054 holiday 0.048 0.014 box_id 0.239 -0.004 weight 0.239 -0.009
The meaningless box identifier, a number between 0 and 100,000, and the irrelevant weight, a continuous measurement, together receive almost half of the impurity importance, more than storm and holiday combined, because their many distinct values let trees split on them repeatedly to fit noise in the training data. Their permutation importances on test data are about zero (slightly negative, which is just noise), correctly revealing them as useless. Both measures agree that distance, storm and holiday matter. Neither measure says anything about causation, and both can mislead when features are strongly correlated, since shuffling one of a correlated pair leaves its partner to carry the information.
Boosting
Boosting answers a question posed by Michael Kearns and Leslie Valiant in 1988: can a weak learner, one that is only slightly better than random guessing, be turned into a strong learner with arbitrarily small error? Robert Schapire showed in 1990 that it can, and Yoav Freund and Schapire's AdaBoost (1995), which earned them the 2003 Gödel Prize, made the idea practical. Where bagging trains models independently and in parallel, boosting trains them in sequence, each one focusing on the examples its predecessors got wrong.
AdaBoost
AdaBoost keeps a weight on every training example, initially uniform. In round m it trains a weak learner \(h_m\), typically a decision stump, to minimize weighted error \(\varepsilon_m\). It gives the learner a vote \(\alpha_m = \frac{1}{2} \ln \frac{1 - \varepsilon_m}{\varepsilon_m}\), which is large when the error is small. Then it reweights the examples, multiplying each weight by \(e^{-\alpha_m y_i h_m(x_i)}\) and renormalizing, so that misclassified examples gain weight and correctly classified ones lose it. The final classifier is a weighted vote:
If every weak learner has weighted error at most \(1/2 - \gamma\), the training error of the vote falls exponentially, at most \(e^{-2\gamma^2 M}\) after M rounds. Later analysis by Friedman, Hastie and Tibshirani showed that AdaBoost is stagewise minimization of the exponential loss \(e^{-y F(x)}\), another convex surrogate for the 0-1 loss, which connected boosting to the rest of statistical learning.
# AdaBoost with decision stumps, written from scratch.
import numpy as np
rng = np.random.default_rng(4)
n = 400
X = rng.uniform(-1, 1, (n, 2))
y = np.where(X[:, 0] ** 2 + X[:, 1] ** 2 < 0.45, 1, -1)       # a circle: no single stump can fit it
Xte = rng.uniform(-1, 1, (4000, 2)); yte = np.where(Xte[:, 0] ** 2 + Xte[:, 1] ** 2 < 0.45, 1, -1)

def best_stump(X, y, w):
    best = (np.inf, None)
    for j in range(X.shape[1]):
        for t in np.unique(X[:, j]):
            for s in (1, -1):
                pred = np.where(X[:, j] < t, s, -s)
                err = w[pred != y].sum()
                if err < best[0]: best = (err, (j, t, s))
    return best

def stump_predict(X, j, t, s): return np.where(X[:, j] < t, s, -s)

w = np.full(n, 1 / n); F_tr = np.zeros(n); F_te = np.zeros(len(yte))
print("round  weighted error  alpha   train error  test error")
for m in range(1, 101):
    err, (j, t, s) = best_stump(X, y, w)
    alpha = 0.5 * np.log((1 - err) / err)
    h = stump_predict(X, j, t, s)
    w *= np.exp(-alpha * y * h); w /= w.sum()                 # up-weight the mistakes
    F_tr += alpha * h; F_te += alpha * stump_predict(Xte, j, t, s)
    if m in (1, 2, 5, 20, 50, 100):
print(f"{m:5} {err:14.3f} {alpha:5.3f} {np.mean(np.sign(F_tr) != y):11.3f} {np.mean(np.sign(F_te) != yte):10.3f}")round weighted error alpha train error test error
1 0.343 0.326 0.343 0.355
2 0.331 0.352 0.435 0.462
5 0.383 0.238 0.152 0.202
20 0.393 0.217 0.040 0.085
50 0.404 0.194 0.010 0.045
100 0.416 0.170 0.003 0.043One stump can only cut the square with a single line, so its error is large. As rounds accumulate, the weighted vote of axis-aligned cuts builds an approximation to the circle, and both training and test error fall. Note that the weighted error of later stumps approaches one half: AdaBoost keeps concentrating weight on the hard examples near the boundary, where no single stump does much better than guessing. Remarkably, AdaBoost's test error often keeps falling after its training error reaches zero, which a margin-based analysis by Schapire, Freund, Bartlett and Lee explained: further rounds increase the margins of the training examples. AdaBoost is, however, sensitive to label noise, since it keeps increasing the weight of mislabelled examples it can never fit.
Gradient boosting
Jerome Friedman's gradient boosting (1999–2001) generalizes boosting to any differentiable loss. The model is an additive expansion \(F_M(\mathbf{x}) = F_0 + \nu \sum_{m=1}^{M} h_m(\mathbf{x})\). At each stage, compute the negative gradient of the loss with respect to the current predictions at each training point, called pseudo-residuals, fit a small regression tree to them, and add it, scaled by a learning rate \(\nu\):
For squared loss the pseudo-residuals are ordinary residuals \(y_i - F_{m-1}(\mathbf{x}_i)\), so each tree literally fits what the ensemble has not yet explained. For log loss they are \(y_i - p_i\), and the same machinery gives a boosted classifier. Gradient boosting is gradient descent in function space: each tree is a step in the direction that most reduces the loss.
# Gradient boosting for regression from scratch: each small tree fits the current residuals.
import numpy as np
from sklearn.tree import DecisionTreeRegressor
from sklearn.ensemble import GradientBoostingRegressor
rng = np.random.default_rng(367)
f = lambda x: np.sin(3 * x[:, 0]) + 0.5 * x[:, 1] ** 2
def sample(n):
    X = rng.uniform(-2, 2, (n, 2)); return X, f(X) + rng.normal(0, 0.3, n)
Xtr, ytr = sample(500); Xte, yte = sample(3000)

nu, M = 0.1, 300                                   # learning rate (shrinkage) and number of trees
F_tr = np.full(len(ytr), ytr.mean()); F_te = np.full(len(yte), ytr.mean())
for m in range(1, M + 1):
    resid = ytr - F_tr                             # negative gradient of squared loss
    tree = DecisionTreeRegressor(max_depth=3, random_state=m).fit(Xtr, resid)
    F_tr += nu * tree.predict(Xtr); F_te += nu * tree.predict(Xte)
    if m in (1, 10, 50, 100, 300):
        print(f"trees {m:3}: train MSE {np.mean((F_tr - ytr) ** 2):.3f}   test MSE {np.mean((F_te - yte) ** 2):.3f}")
sk = GradientBoostingRegressor(n_estimators=M, learning_rate=nu, max_depth=3, random_state=0).fit(Xtr, ytr)
print(f"scikit-learn, same settings: test MSE {np.mean((sk.predict(Xte) - yte) ** 2):.3f} (noise floor 0.090)")trees 1: train MSE 0.906 test MSE 0.889 trees 10: train MSE 0.390 test MSE 0.442 trees 50: train MSE 0.073 test MSE 0.126 trees 100: train MSE 0.049 test MSE 0.112 trees 300: train MSE 0.023 test MSE 0.119 scikit-learn, same settings: test MSE 0.119 (noise floor 0.090)
In the run above, test error is lowest at around 100 trees and has begun to creep up by 300, even though training error keeps falling. Unlike bagging, boosting can overfit if run too long, because each new tree fits more of the training residual, including noise. The defences are shrinkage (a small learning rate such as 0.1 or 0.05, with more trees), shallow trees (depth 3 to 8), subsampling rows and columns for each tree (stochastic gradient boosting), and early stopping when validation error stops improving. The learning rate and the number of trees trade off against each other: halving \(\nu\) roughly doubles the trees needed but usually gives slightly better results.
Modern boosting libraries
Three open-source libraries dominate practice. XGBoost (Tianqi Chen and Carlos Guestrin, 2016) added second-order gradient information, explicit regularization of tree complexity, sparsity-aware split finding and careful systems engineering; it became famous through its record in data science competitions. LightGBM (Microsoft, 2017) grows trees leaf-wise and bins feature values into histograms for speed on large data. CatBoost (Yandex, 2017) handles categorical features with ordered target statistics that avoid a subtle form of leakage. Scikit-learn's HistGradientBoostingClassifier and HistGradientBoostingRegressor provide a fast histogram-based implementation in the standard library. All share Friedman's core algorithm; the differences matter for speed, memory and the handling of categorical and missing values more than for the underlying idea.
Stacking and other combinations
Ensembles need not be homogeneous. Stacking, introduced by David Wolpert in 1992, trains several different models (say a logistic regression, an SVM and a random forest) and then a second-level model that learns how to combine their predictions. To avoid leakage, the second-level model must be trained on out-of-fold predictions: predictions for each training example made by first-level models that did not see it during training, produced by the cross-validation procedure of lesson 9. Simple averaging of diverse strong models is a surprisingly hard baseline to beat, and the winning entries in many prediction competitions, including the Netflix Prize in 2009, have been large blends.
Worked examples
Worked problem
Variance of an average
Each of 50 trees has prediction variance 4 at some input, and the pairwise correlation is 0.3. What is the variance of their average? What if the correlation were 0.1?
Show solution
- With ρ = 0.3: 0.3 × 4 + 0.7 × 4 / 50 = 1.2 + 0.056 = 1.256.
- With ρ = 0.1: 0.1 × 4 + 0.9 × 4 / 50 = 0.4 + 0.072 = 0.472.
Answer: About 1.26 and 0.47: with many trees the correlation term dominates, which is why random forests work to decorrelate them.
Worked problem
One round of AdaBoost
With 10 examples of equal weight 0.1, a stump misclassifies 2. Compute α and the new weights.
Show solution
- ε = 0.2, so α = ½ ln(0.8 / 0.2) = ½ ln 4 ≈ 0.693.
- Misclassified weights are multiplied by e^{0.693} = 2: 0.2 each. Correct ones by e^{−0.693} = 0.5: 0.05 each.
- Total = 2 × 0.2 + 8 × 0.05 = 0.8; normalize by dividing by 0.8.
Answer: α ≈ 0.693; misclassified examples get weight 0.25 each and correct ones 0.0625 each, so the mistakes now carry half the total weight.
Worked problem
A gradient boosting step
With squared loss, current predictions are (2, 5, 3) for targets (3, 4, 6), and the next tree predicts exactly the residuals. With learning rate 0.1, what are the updated predictions?
Show solution
- Residuals: (1, −1, 3).
- Update: (2, 5, 3) + 0.1 × (1, −1, 3) = (2.1, 4.9, 3.3).
Answer: Predictions (2.1, 4.9, 3.3): each step moves a tenth of the way toward the targets, and many trees are needed.
Common mistakes
MistakeAdding more trees to a random forest causes overfitting.
InsteadMore trees only stabilize the average; overfitting in forests comes from other settings, and test error levels off as trees are added.
MistakeBoosting can be run for as many rounds as possible.
InsteadGradient boosting overfits eventually; use a small learning rate and early stopping on validation data.
MistakeImpurity-based feature importance shows which features matter.
InsteadIt favours high-cardinality features; use permutation importance on held-out data, and remember neither implies causation.
MistakeBagging helps every model.
InsteadIt mainly reduces variance, so it helps unstable models like deep trees and does little for linear regression.
MistakeStacking can be trained on in-sample predictions of the base models.
InsteadTrain the combiner on out-of-fold predictions, or it will learn to trust overfit models.
Summary and key terms
- Averaging B models with error correlation ρ leaves variance ρσ² + (1 − ρ)σ²/B; bias is unchanged.
- Bagging trains models on bootstrap samples (about 63% distinct examples) and averages them; out-of-bag examples give a free error estimate.
- Random forests also sample features at each split, decorrelating the trees.
- Permutation importance on held-out data is more reliable than impurity-based importance.
- AdaBoost reweights examples toward past mistakes and combines weak learners in a weighted vote; it minimizes exponential loss.
- Gradient boosting fits each new tree to the negative gradient of the loss (the residuals, for squared loss).
- Boosting needs shrinkage, shallow trees, subsampling and early stopping to avoid overfitting.
- XGBoost, LightGBM and CatBoost are the main modern implementations of gradient boosting.
- Ensemble
- A model that combines the predictions of several models.
- Bootstrap sample
- A sample of n examples drawn with replacement from n training examples.
- Bagging
- Training models on bootstrap samples and averaging their predictions.
- Out-of-bag error
- Error estimated for each example using only the models that did not train on it.
- Random forest
- Bagged decision trees with a random subset of features considered at each split.
- Permutation importance
- The drop in held-out performance when a feature's values are shuffled.
- Weak learner
- A model only slightly better than random guessing.
- AdaBoost
- A boosting algorithm that reweights examples and combines weak learners by weighted vote.
- Gradient boosting
- Boosting that fits each new model to the negative gradient of the loss.
- Shrinkage
- Scaling each boosting step by a learning rate less than 1.
- Stacking
- Training a second-level model to combine the out-of-fold predictions of several models.
Practice problems
Work each problem on paper first, then reveal the answer to check.
Why does averaging leave bias unchanged?
Show answer
The average of models has the same expected prediction as each one.
What fraction of distinct examples does a bootstrap sample contain, on average?
Show answer
About 63.2%.
How does a random forest decorrelate its trees?
Show answer
By considering a random subset of features at each split (as well as bootstrap sampling).
What is a typical number of features per split for classification forests with d features?
Show answer
About √d.
Why did the box identifier get high impurity importance?
Show answer
Its many distinct values let trees split on it to fit training noise.
Give AdaBoost's vote weight formula.
Show answer
α = ½ ln((1 − ε)/ε).
Which loss does AdaBoost minimize stagewise?
Show answer
The exponential loss e^{−yF(x)}.
What are the pseudo-residuals for log loss?
Show answer
y_i − p_i.
Name three defences against overfitting in gradient boosting.
Show answer
Small learning rate, shallow trees, early stopping (also row and column subsampling).
Why must stacking use out-of-fold predictions?
Show answer
In-sample predictions of overfit models look too good, so the combiner would overweight them.
Lesson quiz · 5 questions
Score 60% or more to complete this lesson.
Create a free account to save your progress, take quizzes and earn a certificate.