
CON-260 · Lesson 1 of 12 · 30 min
Digital transformation of construction
Construction is one of the largest industries in both Canada and the United States, and one of the slowest to change the way it works. A typical building is still designed by one set of firms, priced and built by others, and handed to an owner who receives boxes of paper or a folder of PDFs that nobody updates. Over the past two decades, a wave of digital tools has begun to change that: building information modelling (BIM), cloud platforms for documents and field work, reality capture, sensors, analytics and, most recently, artificial intelligence. This course is about those tools, but more importantly about how a construction manager chooses, plans and uses them so that they save time and money rather than adding another layer of software.
Earlier courses introduced some of the vocabulary. CON-120 explained how drawings, CAD and BIM relate and what a common data environment is. CON-200 used BIM quantities in estimating, CON-210 linked schedules to models for 4D, CON-230 covered MEP coordination and CON-250 covered surveying instruments, GNSS, drones and machine control. This course goes deeper on the information side: how models are specified, exchanged, coordinated, checked against reality, turned into data and protected.
Why construction is under pressure to change
The case for digital transformation starts with productivity. In a widely quoted 2017 study, the McKinsey Global Institute estimated that global construction labour productivity grew by only about 1 % a year over the previous two decades, compared with about 2.8 % for the world economy and 3.6 % for manufacturing. Canadian data tell a similar story. A Statistics Canada study released in February 2026 found that labour productivity in residential construction fell by a cumulative 37 % between 2001 and 2023, an average decline of about 2.1 % a year, while the business sector as a whole improved slowly. Small firms, which employ most residential workers, accounted for most of the decline.
Productivity is not the only pressure. Canada faces a large housing shortfall and an ageing skilled workforce, with BuildForce Canada repeatedly forecasting that a large share of the construction workforce will retire within the decade. Public owners want better value for infrastructure spending, insurers want fewer claims, and governments want lower embodied carbon. Each of these depends on better information: knowing what was designed, what was built, what it cost and how it performs.
Construction also has structural features that make change hard. Projects are one-off prototypes built by temporary teams. Most firms are small, with thin margins and little capacity for research. Contracts often split design from construction and give each party a reason to protect its own information rather than share it. Work happens outdoors, in changing conditions, on sites with patchy connectivity. Any technology that ignores these realities tends to fail, however good it looks in a demonstration.
Where information is lost
A useful way to think about digital transformation is to follow information through a project and ask where it is lost or re-created. At each handoff between parties or phases, information that already existed is often re-typed, re-drawn or simply discarded. The architect's model is exported to PDF, the estimator measures the PDF again, the scheduler builds a separate list of activities, the subcontractor redraws the ductwork, the field engineer marks up paper, and the owner's facility manager starts from scratch with a spreadsheet of equipment. Every re-creation costs time and introduces errors.
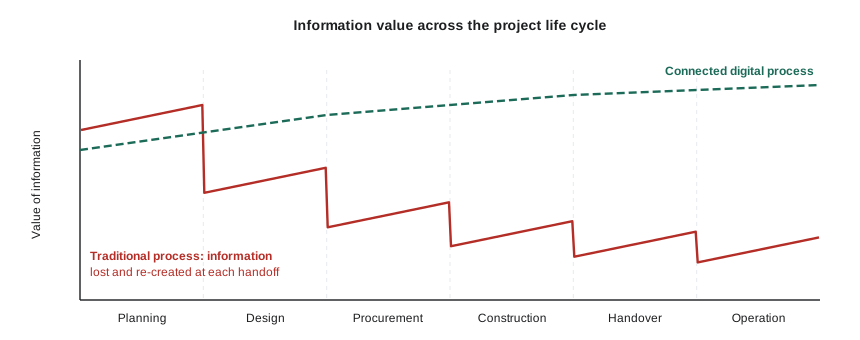
The goal is not to digitize everything for its own sake, but to keep information structured, trusted and connected so it can be reused. A door in a model that carries its fire rating, hardware set, supplier and warranty can feed the door schedule, the estimate, the procurement log, the installation checklist and the facility manager's asset register without anyone typing it twice.
The construction technology landscape
Construction technology, often shortened to ConTech, is a crowded market. Thousands of products compete, many overlap, and new ones appear every year. It helps to sort them by the job they do rather than by brand. The table below groups the main categories used on a typical commercial project. Product names are deliberately left out: this course is vendor-neutral, and the tools will change faster than the categories.
| Category | What it does | Typical users | Covered in |
|---|---|---|---|
| Design authoring | Creates the BIM models and drawings | Architects, engineers, trade detailers | Lesson 3 |
| Model coordination and review | Federates models, finds clashes, tracks issues | BIM coordinators, trades, design team | Lesson 5 |
| Common data environment | Stores, versions and shares project information with controlled status | Everyone | Lesson 4 |
| Estimating and scheduling | Quantity takeoff, cost, CPM and 4D simulation | Estimators, schedulers, project managers | Lesson 6 |
| Field management | RFIs, submittals, daily logs, inspections, punch lists | Superintendents, field engineers, trades | Lesson 7 |
| Reality capture | Scanning, photogrammetry, 360 imagery, progress comparison | Field engineers, surveyors, QA staff | Lesson 8 |
| Data and analytics | Dashboards, reporting, data warehouses | Project controls, executives | Lesson 9 |
| AI, robotics and IoT | Prediction, computer vision, layout and installation robots, sensors | Varies | Lesson 10 |
| Collaboration and security | Contracts, identity, access control, backups | Owners, IT, legal | Lesson 11 |
Most contractors end up with a stack: a small number of core platforms that hold the project record, connected to specialized tools. The biggest practical problems are usually not missing features but poor integration (the same data typed into three systems), unclear ownership (nobody responsible for keeping a tool current) and low adoption in the field.
Digital maturity
Organizations sit at different points on a maturity path. A simple four-level scale is enough for planning. At level 1, information is mostly on paper or in unstructured files such as PDFs and emails. At level 2, the firm uses digital tools in isolated pockets: a 3D model here, a field app there, with little exchange between them. At level 3, information is managed to a common standard, with a common data environment, defined information requirements and models used for coordination, quantities and handover. At level 4, information is integrated across projects and the portfolio, feeding analytics, digital twins and continuous improvement.
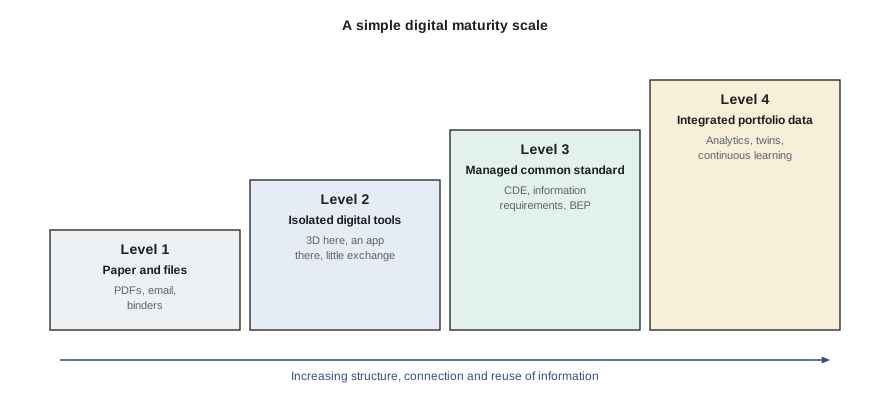
Maturity models are useful because they prevent a firm from buying level-4 technology, such as an AI analytics platform, when its data are still at level 1. Analytics on bad data produce confident-looking nonsense. The usual advice is to fix the foundations first: consistent naming, a single source of truth for documents, standard cost codes and a habit of capturing data at the source.
Owner mandates and standards
Public owners drive much of the change. In Canada there is no single national BIM mandate. Quebec has gone furthest: its government BIM roadmap, launched in 2021 and updated in August 2025 by the Société québécoise des infrastructures and the transport ministry, reported that BIM projects among its partner public owners grew from 77 to 265 between 2021 and 2025, and that nearly three-quarters of SQI's major projects now use BIM and integrated design. The Canadian General Standards Board is adopting the ISO 19650 series as National Standards of Canada, and federal departments, provincial infrastructure agencies and large municipalities increasingly write BIM requirements into their contracts. Lesson 4 looks at these standards in detail.
Internationally, the ISO 19650 series has become the common language for managing information over the life of a built asset. It grew out of British standards developed for the UK government's BIM programme, and is now used in Europe, Australia, Asia and parts of North America. Its central idea is simple: the client defines what information it needs, when and in what form, and the delivery team plans, produces and checks information to meet those requirements.
Benefits and costs
Digital tools are often sold with dramatic claims. A construction manager needs to separate realistic benefits from marketing. The most reliable benefits come from avoiding rework, which industry studies often put at 5 % or more of construction cost, and from saving time spent searching for, re-creating or reconciling information. Field surveys regularly find that site staff spend several hours a week looking for information or resolving conflicting versions.
Worked problem
Estimating the value of rework avoided
A contractor is bidding a $40 million hospital addition. Its historical data show field rework from coordination errors averaged 2.5 % of construction cost on similar projects without model coordination, and 1.0 % on projects with full model coordination. Model coordination will cost about $180,000 (coordinator time, software and trade modelling support). Is it worth it?
Show solution
- Expected rework without coordination = 2.5 % × $40,000,000 = $1,000,000.
- Expected rework with coordination = 1.0 % × $40,000,000 = $400,000.
- Rework avoided = $1,000,000 − $400,000 = $600,000.
- Net benefit = $600,000 − $180,000 = $420,000, before counting schedule savings.
- Return on investment = $420,000 ÷ $180,000 ≈ 2.3, or 233 %.
Answer: On these assumptions coordination returns more than three times its cost. The estimate depends heavily on the firm's own rework data, so it should be tracked and refined project by project.
Costs are easy to underestimate. Software subscriptions are only part of the total. Training, the time staff spend learning, process changes, hardware for the field, integration work and the risk of a tool being abandoned all add up. A common rule of thumb is that the people and process costs of adopting a new platform exceed the licence costs, often by a wide margin.
| Benefit | How it arises | How to measure it |
|---|---|---|
| Less rework | Clashes and errors found in the model, not on site | Rework cost as % of construction cost; field clashes per floor |
| Faster answers | RFIs and submittals tracked and routed digitally | Average RFI turnaround in days |
| Better estimates | Quantities taken from models and checked | Variance between estimated and actual quantities |
| Fewer disputes | Time-stamped records, photos and logs | Claims and change-order disputes per project |
| Safer sites | Hazards visualized and planned; data on incidents | Recordable incident rate; near-miss reporting rate |
| Better handover | Structured asset data delivered with the building | Days to load the owner's maintenance system |
Adoption: people, process, technology
Most failed technology projects in construction fail for human reasons. A superintendent who has run successful jobs for twenty years will not trust a tablet app that slows him down. A subcontractor will not model in 3D if the contract does not pay for it. A project engineer will not update a dashboard nobody reads. The common framework of people, process and technology is a reminder that all three must change together.
- People: identify champions on each site, train in short sessions tied to real tasks, and involve field staff in choosing tools.
- Process: decide what the tool replaces. If a new daily-log app is introduced, the paper log must stop, or staff will do both.
- Technology: choose tools that work offline, integrate with existing systems and export data in open formats.
Pilot projects are the standard way to test a new tool. A good pilot has a clear question (for example, does 360-degree photo documentation reduce disputes over concealed work?), a defined measure, a fair comparison and an honest review. A bad pilot is chosen because the vendor offered a free trial and is declared a success because nobody wants to admit it was not used.
Worked problem
Comparing two field-app rollouts
Two superintendents introduce the same inspection app. Site A gets a two-hour classroom session and is told to use it. Site B appoints a field champion, holds three 20-minute sessions during morning huddles, retires the paper forms the same week and reviews usage weekly. After two months, Site A has 18 inspections logged against roughly 120 performed; Site B has 104 logged against 110 performed. What is the adoption rate on each site, and what explains the difference?
Show solution
- Site A adoption = 18 ÷ 120 = 15 %.
- Site B adoption = 104 ÷ 110 ≈ 95 %.
- Site B tied training to real work, removed the parallel paper process and had a local champion.
- Site A left the old process in place, so the app became optional extra work.
Answer: Adoption depends far more on process change and local leadership than on the software itself.
Information as an asset
A building lasts fifty years or more, far longer than any software product. Most of a building's life-cycle cost is spent in operation, not construction, so the information delivered at handover can be worth more than the information used during construction. This is why owners increasingly specify information requirements for the whole life of the asset, not just for the design and construction phases, and why open, non-proprietary formats such as IFC and COBie matter (Lessons 3 and 4).
Information also carries legal weight. Daily logs, photos, model versions and RFI records are evidence in claims and disputes. They must be accurate, time-stamped, retained for the required period and protected from tampering or loss. Lesson 11 returns to the contractual and security questions this raises.
A roadmap for a construction manager
A practical digital roadmap for a mid-sized contractor usually follows a sequence. First, standardize: one document platform, consistent file naming, standard cost codes and templates. Second, connect: integrate the document platform with estimating, scheduling and accounting so data flow rather than being re-typed. Third, model: use BIM for coordination and quantities on suitable projects, with clear execution plans. Fourth, measure: capture field data at the source and build a small number of dashboards that people actually use. Fifth, extend: experiment with reality capture, analytics and automation where the foundations are solid.
Throughout, the construction manager's role is to keep technology in service of the project's goals: safety, quality, schedule, cost and the owner's long-term needs. The rest of this course follows that approach, starting with what BIM really is.
Common mistakes
MistakeBuying advanced software before the basic information is organized.
InsteadFix naming, document control, cost codes and data capture first; analytics on poor data mislead.
MistakeRunning a new digital process alongside the old paper one indefinitely.
InsteadDecide what the tool replaces and retire the old process on a set date.
MistakeJudging a tool by a vendor demonstration.
InsteadRun a pilot with a clear question, a measure and an honest review on a real project.
MistakeCounting only licence fees as the cost of technology.
InsteadInclude training, time, hardware, integration, support and the risk of abandonment.
MistakeTreating handover information as an afterthought.
InsteadPlan asset information from the start; owners use it for decades.
Summary and key terms
- Construction productivity has grown slowly for decades, and Canadian residential productivity fell between 2001 and 2023.
- Information is lost at each handoff in a traditional process; digital transformation aims to keep it structured and reusable.
- ConTech tools fall into categories: authoring, coordination, common data environments, estimating and scheduling, field management, reality capture, analytics, AI and robotics, and security.
- A simple maturity scale runs from paper (level 1) to integrated portfolio data (level 4).
- Owners and standards such as ISO 19650 drive adoption.
- The most reliable benefits are less rework and less time spent searching for or re-creating information.
- Adoption depends on people and process as much as technology; pilots need clear questions and measures.
- Information is a long-lived asset and legal record.
- Digital transformation
- Changing how an organization works by using digital information and tools, not merely digitizing paper.
- ConTech
- Construction technology: software, hardware and data tools used in the built environment.
- Labour productivity
- Output per hour worked.
- Handoff
- A point where information passes from one party or phase to another.
- Digital maturity
- How consistently and deeply an organization uses managed digital information.
- Single source of truth
- One authoritative location for each piece of information.
- Rework
- Work done again because it was wrong the first time.
- Pilot project
- A limited trial of a new tool or process with defined measures.
- Field champion
- A site-based person who supports and promotes a new tool.
- Asset information
- Data about a built asset needed to operate and maintain it.
Practice problems
Work each problem on paper first, then reveal the answer to check.
According to the 2017 McKinsey study, how did construction productivity growth compare with the world economy?
Show answer
About 1 % a year versus about 2.8 % for the world economy.
What did the 2026 Statistics Canada study find about residential construction productivity from 2001 to 2023?
Show answer
It fell by a cumulative 37 %, about 2.1 % a year.
Give three handoffs where information is commonly re-created on a project.
Show answer
Design to estimating, design to trade detailing, construction to facility management (others: schedule, field markups).
A $25 million project has 3 % rework without coordination and 1.2 % with it. Coordination costs $150,000. What is the net benefit?
Show answer
Avoided rework = 1.8 % × $25M = $450,000; net = $300,000.
Name the three elements that must change together for adoption to succeed.
Show answer
People, process and technology.
Why should a firm avoid buying an AI analytics platform at maturity level 1?
Show answer
Its data are unstructured and unreliable, so analytics would produce misleading results.
What is the central idea of ISO 19650?
Show answer
The client defines information requirements and the delivery team plans, produces and checks information to meet them.
An app logs 45 of 150 inspections. What is the adoption rate?
Show answer
30 %.
Why is handover information valuable?
Show answer
Operation is most of a building's life-cycle cost and the owner uses the information for decades.
List the five steps of the roadmap described in the lesson.
Show answer
Standardize, connect, model, measure, extend.
Lesson quiz · 5 questions
Score 60% or more to complete this lesson.
Create a free account to save your progress, take quizzes and earn a certificate.