
CON-260 · Lesson 8 of 12 · 34 min
Reality capture for construction quality
Models describe what should be built. Reality capture records what is actually there. Laser scanners, photogrammetry from drones and handheld cameras, 360-degree site cameras and mobile mapping systems can capture existing conditions, progress and installed work in hours, producing point clouds, meshes and imagery that can be compared with the design. CON-250 explained how scanners and drones measure and the rules for flying drones. This lesson focuses on how a construction manager uses captured data for quality assurance: specifying accuracy and density, scan-to-BIM for existing buildings, scan-versus-model comparison of installed work, progress monitoring, and managing the large data sets involved.
Capture methods compared
Each capture method trades accuracy, speed, cost and coverage differently. Terrestrial laser scanners on tripods give the highest accuracy over building-scale distances. Mobile and handheld scanners, often using simultaneous localization and mapping (SLAM), are much faster but less accurate and can drift over long paths. Photogrammetry builds 3D geometry from overlapping photographs; from drones it covers large sites quickly, while from the ground it records façades and interiors. 360-degree cameras, often worn on a helmet during a site walk, produce navigable photo records rather than precise geometry.
| Method | Typical accuracy (illustrative) | Speed | Best for |
|---|---|---|---|
| Terrestrial laser scanner | 2–6 mm at building distances | Slow to moderate (many setups) | As-builts, structural and MEP verification, existing conditions |
| Mobile or handheld SLAM scanner | 10–30 mm, depends on path and loop closure | Fast (walking pace) | Large interiors, quick progress capture |
| Drone photogrammetry | A few centimetres with ground control | Fast for large areas | Earthworks, roofs, site progress, stockpiles |
| Ground photogrammetry | Varies with camera and overlap | Moderate | Façades, heritage elements, small objects |
| 360-degree camera walk | Visual record, not survey-grade geometry | Very fast | Progress documentation, concealed work records |
Choosing a method starts with the question being asked. Checking that embedded anchor bolts are within a few millimetres needs a total station or a terrestrial scanner, not a 360-degree camera. Documenting what is inside a wall before drywall goes on needs a fast, complete photo record, not millimetre accuracy. Many projects use several methods together.
Specifying accuracy and density
Two separate properties describe a point cloud. Accuracy is how close the measured points are to their true positions, usually expressed as a standard deviation or a tolerance range at a confidence level. Density is how closely spaced the points are on the surface, expressed as point spacing (for example, one point every 6 mm at 10 m) or points per square metre. A cloud can be dense but inaccurate, or accurate but too sparse to show small features.
In North America, the U.S. Institute of Building Documentation publishes a Level of Accuracy (LOA) specification that defines accuracy bands for measured data and for represented data (models made from it), widely used in Canada as well as the United States. For example, LOA 30 corresponds to a range of 15 mm down to 5 mm at two standard deviations, and LOA 40 to 5 mm down to 1 mm. A scope of work should state the LOA required for measurement and for the resulting model, by element type if necessary, together with the control network and registration method.
Worked problem
Point spacing and feature size
A scanner set to a resolution of 6.3 mm point spacing at 10 m is used to capture a mechanical room. The farthest surfaces are about 15 m away. Point spacing grows in proportion to distance. The team needs to see 25 mm threaded rod hangers reliably, which requires at least three points across the rod. Is the setting adequate?
Show solution
- Spacing at 15 m = 6.3 × 15 ÷ 10 ≈ 9.5 mm.
- Points across a 25 mm rod ≈ 25 ÷ 9.5 ≈ 2.6, fewer than 3.
- Near the scanner (5 m) spacing would be about 3.2 mm, giving about 8 points across the rod.
- Options: add setups so no target surface is farther than about 10 m, or use a higher resolution setting at the cost of longer scan times.
Answer: Not adequate at the far end of the room. More setups or a finer setting are needed to capture hangers reliably.
Registration, the process of aligning separate scans into one coordinate system, introduces its own error. Scans can be registered to each other by matching overlapping geometry (cloud-to-cloud) or by targets, and tied to the project coordinate system through targets surveyed with a total station from site control (CON-250). For quality assurance comparisons against a model, tying scans to project control is essential; otherwise any registration error looks like a construction error.
Scan-to-BIM for existing buildings
Renovations, additions and retrofits begin with existing conditions that are often poorly documented. Original drawings may be missing or wrong, and decades of alterations rarely appear on them. Scan-to-BIM means capturing the existing building and modelling it from the point cloud, so the design team starts from reality rather than from assumptions. It is now routine on hospital renovations, heritage buildings, industrial plants and complex interiors.
Scan-to-BIM should be scoped carefully. Modelling every pipe and cable tray in an existing ceiling space at high accuracy can cost more than the design itself. The scope should say which elements to model, to what LOD and LOA, and which areas can stay as point cloud only for reference. Designers increasingly work directly with the point cloud as a background in their authoring tools, modelling only what they need to change or connect to.
Worked problem
Scoping a scan-to-BIM job
An owner plans to renovate two floors (3,200 m² each) of a 1970s hospital. A scanning firm quotes: capture at $0.90/m² of floor area per floor; modelling architecture and structure at LOD 200 / LOA 20 for $1.80/m²; modelling all above-ceiling MEP at LOD 300 / LOA 30 for $4.50/m². The design team needs MEP modelled only in the main corridors (about 18 % of the floor area) where new services must connect. Compare a full scope with a targeted scope.
Show solution
- Total floor area = 2 × 3,200 = 6,400 m².
- Capture = 6,400 × $0.90 = $5,760; architecture and structure = 6,400 × $1.80 = $11,520.
- Full MEP = 6,400 × $4.50 = $28,800; full scope total = $46,080.
- Targeted MEP = 0.18 × 6,400 × $4.50 = $5,184; targeted total = $22,464.
- The rest of the above-ceiling space remains as point cloud for reference.
Answer: The targeted scope costs about half as much and still gives the designers what they need. The point cloud remains available if questions arise elsewhere.
Scan versus model: checking installed work
On new construction, scanning installed work and comparing it with the coordinated model is a powerful quality check. Deviation analysis computes the distance from each point to the nearest model surface and colours the result: green within tolerance, yellow near the limit, red beyond it. Typical uses include checking slab flatness and elevations before finishes, verifying embeds and sleeves before a pour, confirming that MEP installation matches the coordinated model before ceilings close, and checking structural steel or precast placement.
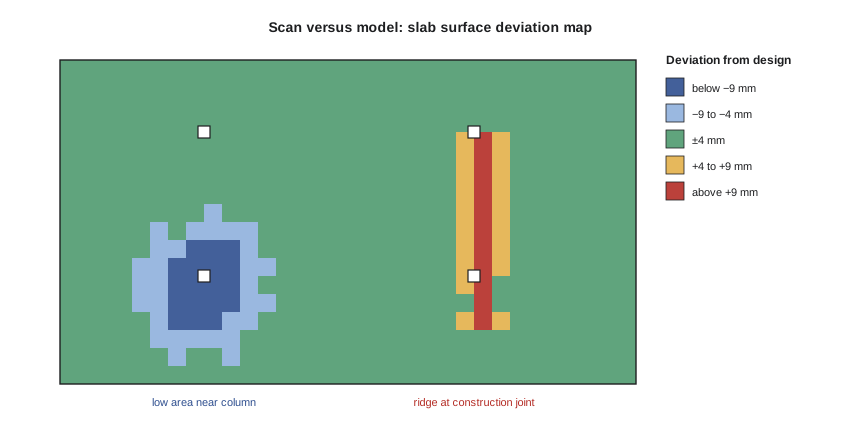
The following script simulates deviations between scan points and a design surface, then reports the statistics a quality manager would look at.
import random, statistics

random.seed(8)
# Simulated deviations (mm) of 2,000 scan points from the design slab surface:
# most points near zero, plus a sagging bay near one column.
devs = [random.gauss(0.5, 3.0) for _ in range(1850)] + [random.gauss(-12, 3.0) for _ in range(150)]

tol = 8.0   # +/- 8 mm tolerance for this check (illustrative)
within = sum(abs(d) <= tol for d in devs)
print(f"points: {len(devs)}")
print(f"mean {statistics.mean(devs):+.1f} mm, std dev {statistics.stdev(devs):.1f} mm")
print(f"min {min(devs):+.1f} mm, max {max(devs):+.1f} mm")
print(f"within +/-{tol:.0f} mm: {within} ({within / len(devs):.1%})")
low = sum(d < -tol for d in devs)
print(f"below tolerance: {low} points -> inspect for sag or low spots")points: 2000 mean -0.4 mm, std dev 4.4 mm min -20.6 mm, max +10.0 mm within +/-8 mm: 1844 (92.2%) below tolerance: 142 points -> inspect for sag or low spots
The summary statistics show most of the slab within tolerance but a cluster of low points. In practice the colour map would show where they are, and the team would decide whether to grind, fill or accept them, depending on the specified tolerance and the finish to be applied. Concrete floor flatness and levelness are normally specified with their own measurement methods, and a scan comparison supplements rather than replaces the specified test.
Worked problem
Checking sleeves before a pour
Before a level 5 slab pour, a scan of the formwork and placed sleeves is compared with the coordinated model. Of 214 sleeves, 198 are within the 15 mm tolerance, 11 are 15–40 mm off, 3 are more than 40 mm off and 2 are missing. What is the conformance rate and what should happen before the pour?
Show solution
- Conforming sleeves = 198 ÷ 214 ≈ 92.5 %.
- Nonconforming = 11 + 3 + 2 = 16.
- The 2 missing sleeves and 3 badly misplaced ones must be fixed before the pour; coring later is expensive and may hit reinforcing or post-tensioning tendons.
- The 11 moderately misplaced sleeves should be checked against the trade models: some may still work, others need moving.
Answer: About 92.5 % conform. At least 5 sleeves must be corrected and 11 reviewed before the pour. The scan takes hours; coring after the pour could take days and need engineering review.
Progress monitoring
Repeated capture builds a history of the site. Weekly 360-degree walks or drone flights let the project team, the owner and remote specialists see the site as it was on any date. Comparing successive captures with the 4D model (Lesson 6) shows which elements are installed, which are late and which are ahead. Some platforms use computer vision to detect installed elements automatically, such as studs, drywall, ductwork or concrete, and report percent complete by area.
Worked problem
Percent complete from capture
An automated progress tool compares this week's scan of level 2 with the model. The level has 1,240 m of interior stud wall in the model; 930 m are detected as framed and 410 m as boarded on one side. The schedule planned 1,000 m framed and 500 m boarded by this date. What are the percent-complete figures and schedule performance for each activity?
Show solution
- Framing: 930 ÷ 1,240 = 75 % complete; planned 1,000 ÷ 1,240 ≈ 81 %.
- Framing performance = 930 ÷ 1,000 = 0.93 of plan.
- Boarding: 410 ÷ 1,240 ≈ 33 % complete; planned 500 ÷ 1,240 ≈ 40 %.
- Boarding performance = 410 ÷ 500 = 0.82 of plan.
- Boarding is falling further behind than framing, which may indicate a crew or material problem to investigate.
Answer: Framing is 75 % complete (93 % of plan) and boarding 33 % (82 % of plan). The capture gives an objective basis for the progress discussion.
Automated progress detection is improving quickly but is not perfect. Occlusion (elements hidden behind others), similar-looking elements and partial installation confuse the algorithms. A sensible approach is to use automated results as a first pass, verified by the superintendent, rather than as an unquestioned measure for payment.
Documenting concealed work
One of the most practical uses of reality capture is documenting work before it is concealed. A 360-degree walk or scan of every wall and ceiling before drywall or ceilings close creates a record of what is inside: pipes, conduit, blocking, fire stopping, insulation, vapour barrier. Months or years later, a maintenance technician can see where a pipe runs before cutting into a wall, and a dispute about whether fire stopping was installed can be settled from the images. Owners increasingly require this documentation at handover.
Managing reality capture data
Point clouds are large. A single high-resolution terrestrial scan can be hundreds of megabytes; a full building can run to hundreds of gigabytes or more. Weekly captures over a two-year project multiply that. The BIM execution plan should say where data will be stored, in what formats (E57 is the common open format), at what resolution for each use, who can access it and how long it will be kept. Decimated or tiled versions are used for viewing, with full-resolution data archived.
Worked problem
Estimating storage
A project captures a 360-degree walk weekly (about 4 GB per walk) for 80 weeks, and a full terrestrial scan at three milestones (about 250 GB each). Drone flights every two weeks produce about 6 GB each. Estimate total storage.
Show solution
- 360 walks: 80 × 4 GB = 320 GB.
- Terrestrial scans: 3 × 250 GB = 750 GB.
- Drone flights: 40 × 6 GB = 240 GB.
- Total ≈ 320 + 750 + 240 = 1,310 GB, about 1.3 TB, before backups and processed derivatives.
Answer: About 1.3 TB of raw data. With processed outputs and a backup copy, plan for three to four times that.
Privacy also matters. Site cameras and 360-degree walks capture images of workers, neighbours and the public. Projects should tell workers how images are used, avoid capturing private property where possible, blur faces and licence plates where required, and follow privacy law (Lesson 11). Drone flights must follow aviation rules and any site-specific restrictions (CON-250).
Common mistakes
MistakeChoosing a capture method by habit rather than by the question being asked.
InsteadMatch method to required accuracy, density, speed and coverage.
MistakeSpecifying 'scan to 2 mm' without defining accuracy, density and confidence.
InsteadSpecify LOA for measurement and modelling, point spacing, control and registration method.
MistakeComparing scans with the model without tying them to project control.
InsteadRegister scans to surveyed targets on site control so deviations are real.
MistakeModelling every existing element at high LOD.
InsteadScope scan-to-BIM to the elements and areas the design needs; keep the rest as point cloud.
MistakeUsing automated progress results for payment without checking.
InsteadVerify automated detection with field review before relying on it.
Summary and key terms
- Reality capture methods range from terrestrial scanning to SLAM, photogrammetry and 360-degree walks, each with different accuracy and speed.
- Accuracy and density are separate; the USIBD LOA specification defines accuracy bands.
- Registration to project control is essential for comparisons with the model.
- Scan-to-BIM should be scoped to what the design needs.
- Deviation analysis checks slabs, embeds, sleeves, steel and MEP against the model before work is covered or built on.
- Repeated captures support progress monitoring, increasingly with computer vision.
- Recording concealed work is valuable for maintenance and disputes.
- Point cloud data are large and must be planned for storage, access, retention and privacy.
- Reality capture
- Recording existing or built conditions with scanning, photogrammetry or imagery.
- Point cloud
- A set of measured 3D points representing surfaces.
- SLAM
- Simultaneous localization and mapping, used by mobile scanners to track position while capturing.
- Point spacing
- The distance between adjacent points on a scanned surface.
- Level of Accuracy (LOA)
- USIBD bands describing the accuracy of measured and modelled data.
- Registration
- Aligning separate scans into one coordinate system.
- Scan-to-BIM
- Creating a BIM model from point cloud data of existing conditions.
- Deviation analysis
- Measuring and colour-coding distances between scan points and a model.
- Computer vision
- Software that interprets images to detect objects or changes.
- E57
- An open ASTM file format for point clouds and imagery.
Practice problems
Work each problem on paper first, then reveal the answer to check.
Which capture method gives the best accuracy for checking anchor bolts?
Show answer
A total station or terrestrial laser scanner tied to site control.
A scanner has 5 mm spacing at 10 m. What is the spacing at 20 m?
Show answer
About 10 mm.
What is the difference between accuracy and density?
Show answer
Accuracy is closeness to true position; density is how closely points are spaced.
Why tie scans to project control for QA?
Show answer
So registration errors are not mistaken for construction errors.
Of 300 embeds scanned, 282 are in tolerance. What is the conformance rate?
Show answer
94 %.
Name two causes of errors in automated progress detection.
Show answer
Occlusion, similar-looking elements, partial installation.
Why document walls before they are closed?
Show answer
To record concealed services for maintenance and to settle disputes.
Estimate storage for 60 weekly walks at 5 GB each.
Show answer
300 GB.
What open format is common for point clouds?
Show answer
E57.
Name two privacy precautions for site imagery.
Show answer
Tell workers how images are used, blur faces and plates, avoid capturing private property.
Lesson quiz · 5 questions
Score 60% or more to complete this lesson.
Create a free account to save your progress, take quizzes and earn a certificate.