
CRE-201 · Lesson 2 of 12 · 25 min
Signals: watch time, engagement and shares
Recommendation systems decide what to show based on signals: measurable information about content, people and their interactions. Some signals are explicit, such as likes and follows; many more are implicit, such as how long someone watched, whether they rewatched, or whether they scrolled past in under a second. Understanding which signals exist, what they reveal about viewers, and how platforms weigh them helps creators make content that performs for the right reasons. This lesson covers the main categories of signals, watch time and retention, completion and rewatches, engagement actions, shares and sends, saves, follows, negative feedback, satisfaction surveys, content understanding signals, context signals, and why chasing individual metrics can backfire.
Categories of signals
Signals fall into several broad groups:
- Viewer behaviour on the content: impressions, clicks or taps, watch time, completion, rewatches, pauses, skips, scrolling speed.
- Explicit engagement: likes, comments, shares, sends in direct messages, saves, follows, profile visits, clicks on links.
- Negative feedback: "not interested", hide, mute, block, unfollow, report, quick skips.
- Survey responses: answers to questions about whether a post was worth the time or how the person felt about it.
- Content features: visual, audio and text content, topics, language, sounds, length, format, quality and originality.
- Creator and account features: history, consistency, policy record, relationships with viewers.
- Viewer features and context: interests, past behaviour, location, language, device, time of day, network speed, what they just watched.
Ranking models combine these into predictions. No single signal determines reach, and the importance of each varies by platform, surface and situation.
Watch time and retention
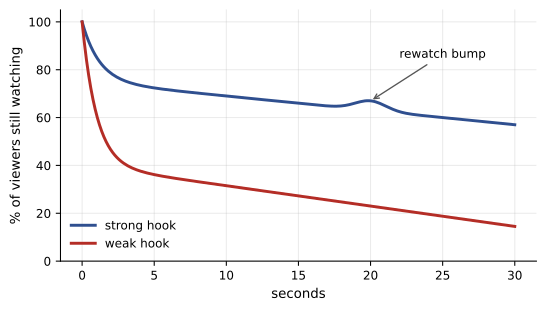
For video platforms, how long people watch is among the most informative signals, because watching requires a real investment of attention. Platforms track total watch time, average view duration (AVD), and average percentage viewed. A retention curve shows what percentage of viewers are still watching at each moment of a video: most curves drop sharply in the first seconds as people decide whether to stay, then decline more gradually, with dips where viewers lose interest and bumps where they rewind or rewatch. A strong opening that holds viewers through the first few seconds is therefore critical, which is why hooks are emphasized so heavily (CRE-120, CRE-210). For long-form video, YouTube creators commonly watch the percentage of viewers still present after 30 seconds as an early indicator. CRE-202 covers reading retention curves in detail.
Completion and rewatches
On short-form platforms, completion rate, the share of viewers who watch to the end, and rewatches or loops, where viewers watch again, are especially strong signals. A 20-second video that most people watch twice tells the system that viewers found it compelling. This is why short videos with satisfying endings, surprising twists, dense information that rewards rewatching, or seamless loops can perform well. Length involves a trade-off: shorter videos are easier to complete, but longer videos accumulate more watch time per view if they hold attention. Platforms have generally extended maximum lengths for short-form content, and some have said that longer videos are given room to perform when viewers watch them; creators should choose length to suit the content rather than a rule.
Worked problem
Comparing two videos
Video A is 15 seconds long; viewers watch on average 13 seconds, and 20 % rewatch. Video B is 60 seconds long; viewers watch on average 27 seconds. Which provides more watch time per view, and which shows stronger satisfaction?
Show solution
- Video A: average watch time per view is 13 seconds plus rewatches; with 20 % rewatching once fully, about 13 + 0.2 × 15 = 16 seconds.
- Video B: 27 seconds per view, more total watch time.
- Video A's average percentage viewed is about 107 % including rewatches; Video B's is 45 %.
- Video A signals stronger satisfaction relative to its length; Video B gives more total time but loses over half its viewers.
Answer: Video B gives more watch time per view (27 s vs about 16 s), but Video A shows stronger relative retention and satisfaction; platforms weigh both, so neither metric alone decides.
Engagement actions
Likes, comments, shares, saves and follows are explicit signals of interest. Each means something different:
- Likes are quick and low-effort, signalling approval.
- Comments show strong reactions and spark conversation, but can be positive or negative; platforms increasingly assess comment quality and may discount spammy or hostile comments.
- Shares, including sending a post to friends in direct messages, indicate that viewers found something valuable enough to pass on, and bring new viewers. Instagram's leaders have said publicly that sends are among the most important signals for reaching new audiences on Instagram.
- Saves indicate lasting value: recipes, tutorials, tips and inspiration that people want to return to.
- Follows after viewing indicate that a viewer wants more from the creator.
Because engagement rates differ hugely between formats and platforms, the meaningful comparison is with similar content in similar contexts, not with a universal benchmark.
| Signal | What it suggests | Content that tends to earn it |
|---|---|---|
| Completion and rewatch | Compelling, satisfying content | Strong hooks, payoffs, loops, dense value |
| Shares and sends | Worth passing on | Relatable, funny, surprising, useful to friends |
| Saves | Lasting reference value | Recipes, tutorials, lists, guides |
| Comments | Strong reaction or conversation | Questions, opinions, stories, debates |
| Follows | Desire for more from the creator | Clear niche, series, distinctive voice |
Negative signals
Negative feedback is as important as positive engagement. Quick scrolling past a post within a second or two, tapping "not interested", hiding, muting, unfollowing, blocking and reporting all tell the system that the content was unwelcome. Platforms weigh these heavily because a feed full of unwanted content drives people away. Content that attracts many clicks but leaves people disappointed, such as misleading thumbnails or bait-and-switch hooks, may perform briefly and then be suppressed as negative signals accumulate. Reports also feed moderation systems, which may remove content or limit distribution (Lesson 11). Creators cannot see most negative signals directly, but sudden drops in distribution after initially strong performance can indicate that viewers felt misled.
Satisfaction surveys
Because behaviour does not always reflect satisfaction, platforms ask samples of users directly. YouTube shows some viewers surveys after videos, asking them to rate them, and has said that satisfaction predictions trained on survey responses shape recommendations. Facebook and Instagram have asked users whether posts were worth their time. These surveys help systems distinguish between content people feel good about and content that captures attention compulsively but leaves people regretting the time spent. For creators, this means that content that viewers genuinely appreciate tends to be favoured over time compared with content that simply grabs attention.
Content understanding signals
Platforms analyse the content itself using computer vision, audio analysis, speech recognition and language models. They identify objects, scenes, faces, text on screen, spoken words, music, topics and language, which helps match content to interested viewers, especially when a post is new and has little behavioural data. Captions, titles, descriptions, on-screen text, hashtags and spoken keywords therefore help platforms understand what a post is about, particularly for search (Lesson 8). Platforms also assess quality and originality: several, including Instagram, YouTube and Facebook, have said they reduce distribution for reposted or unoriginal content and favour original creators, and that visible watermarks from other platforms may reduce distribution. Content understanding also feeds integrity systems that detect policy violations, spam and misleading content.
Context and viewer signals
The same post may be recommended differently depending on who is viewing and when. Viewer history, including topics, creators and formats they engage with, is the most important factor in personalization. Language and location determine which content is eligible and relevant. Time of day, device and network speed may affect which formats are shown, for example longer videos on Wi-Fi in the evening. Session context, what the person just watched, influences the next recommendation. Creators cannot control these factors, but understanding them explains why analytics show different performance across audiences and regions.
Relationship and creator signals
Platforms also consider the relationship between viewers and creators: whether a person follows a creator, has engaged with them recently, watches most of their videos, or has messaged them. Followers who regularly engage are more likely to be shown new posts quickly. Account-level signals, such as consistent posting, policy compliance, originality and the creator's history of audience satisfaction, may influence how new content is initially tested, though platforms generally emphasize that each post is evaluated on its own performance. Accounts with policy strikes or a history of spam may have restricted distribution.
Why chasing single metrics backfires
Because creators can see some metrics, it is tempting to optimize them directly: asking for likes, prompting comments with "comment yes if you agree", making videos artificially short to raise completion, or using shocking thumbnails to raise click-through. Platforms are aware of these tactics and train their systems to discount them. Engagement bait, such as asking people to like, comment or share for its own sake, is explicitly demoted on some platforms. Misleading packaging raises clicks but also negative signals. The underlying principle, sometimes summarized as Goodhart's law, is that when a measure becomes a target, it ceases to be a good measure. Creators get better long-term results by focusing on what the signals are trying to capture, real interest and satisfaction, and using metrics to diagnose rather than to game.
Signals in images and carousels
For still images and carousels, platforms cannot measure watch time in the same way, so they rely on other signals: dwell time, how long a person pauses on a post; swipes through carousel slides; taps to expand captions; saves; shares; profile taps; and comments. A carousel that people swipe through to the last slide, and save to return to, signals strong value. Image quality, composition and clarity on small screens affect whether people pause at all. Alt text and captions help platforms understand image content, especially for search.
Signals change by surface
The same signal can mean different things on different surfaces. A like in Stories, a like on a Reel seen by a stranger, and a like on a post in the main feed from a close friend each reveal different things, and platforms weight them accordingly. Search surfaces emphasize whether people found what they wanted, while following feeds emphasize relationships. This is why advice that works for one surface, such as "ask questions to get comments", may not help on another. Creators benefit from understanding which surfaces drive their reach and what each surface's system values.
Reading signals in analytics
Platform analytics show some, but not all, of the signals the system uses. Creators usually see views or reach, watch time, retention, likes, comments, shares, saves, follows and traffic sources; they rarely see negative feedback or survey results. Reading available signals together, rather than in isolation, gives a better picture: a post with modest likes but high shares and saves may be reaching new people effectively, while a post with many likes but low watch time may have attracted quick approval without deep interest. CRE-202 develops these skills.
Signals and accessibility
Accessible content can also send better signals. Captions let people watch with the sound off, which many do in public, increasing watch time from viewers who would otherwise scroll past. Clear on-screen text helps viewers follow quickly, and alt text helps image posts reach people using screen readers and appear in search. Accessibility practices therefore serve both inclusion and performance, a rare case where doing the right thing and doing the effective thing align closely.
A balanced view of metrics
Metrics are tools for understanding, not verdicts on a creator's worth. The most useful habit is to ask what each number says about viewers' experience, then make content that improves that experience. When the experience improves, the signals usually follow.
Common mistakes
MistakeTreating likes as the most important signal.
InsteadConsider watch time, completion, shares, saves and satisfaction.
MistakeUsing engagement bait to boost comments.
InsteadInvite genuine conversation and value.
MistakeMisleading hooks and thumbnails.
InsteadDeliver what the packaging promises.
MistakeReposting others' content or watermarked clips.
InsteadCreate and post original work.
MistakeComparing engagement rates across unlike formats.
InsteadCompare with similar content and audiences.
Summary and key terms
- Signals include behaviour, engagement, negative feedback, surveys, content, account and context.
- Watch time and retention reveal real attention, especially in the first seconds.
- Completion and rewatches matter greatly in short-form video.
- Shares, sends and saves indicate value worth passing on or returning to.
- Negative feedback is weighed heavily and can suppress misleading content.
- Content understanding matches posts to viewers and rewards originality.
- Optimizing single metrics backfires; aim at genuine interest and satisfaction.
- Signal
- Measurable information used by a recommender.
- Implicit signal
- Behaviour that reveals interest without explicit action.
- Average view duration
- Average time viewers watch a video.
- Retention curve
- Share of viewers watching at each moment.
- Completion rate
- Share of viewers who watch to the end.
- Send
- Sharing a post privately in a message.
- Negative feedback
- Signals that content was unwelcome.
- Satisfaction survey
- Questions asking viewers how they felt about content.
- Engagement bait
- Prompts asking for interactions for their own sake.
- Goodhart's law
- A measure used as a target stops being a good measure.
Practice problems
Work each problem on paper first, then reveal the answer to check.
Name four categories of signals.
Show answer
Behaviour, engagement, negative feedback, surveys, content, account, context.
Why is watch time informative?
Show answer
It requires a real investment of attention.
Where do retention curves usually drop most?
Show answer
In the first few seconds.
Why do loops help short videos?
Show answer
Rewatches signal compelling content.
What do saves indicate?
Show answer
Lasting reference value.
Why do sends matter for new audiences?
Show answer
They bring the post to new viewers via friends.
Name three negative signals.
Show answer
Quick skips, not interested, hide, unfollow, report.
What do satisfaction surveys help distinguish?
Show answer
Appreciated content from compulsive attention capture.
Why might watermarked reposts be limited?
Show answer
Platforms favour original content.
What does Goodhart's law warn about?
Show answer
Targeting a measure distorts it.
Lesson quiz · 5 questions
Score 60% or more to complete this lesson.
Create a free account to save your progress, take quizzes and earn a certificate.