
CRE-202 · Lesson 1 of 12 · 25 min
Why analytics matter
Every platform a creator uses records an enormous amount of information about how people find, watch, read, share and react to content. Analytics dashboards turn that information into numbers and charts: views, reach, watch time, retention, followers gained and lost, clicks, revenue. These numbers can be a creator's most useful guide, revealing what works and why, or a source of anxiety and bad decisions when they are misread or chased for their own sake. CRE-201 explained how recommendation systems use signals to decide what people see. This course is about the other side of the dashboard: how creators read their own data and turn it into decisions. This first lesson explains what analytics are for, the difference between data, metrics and insights, the questions analytics can and cannot answer, how to choose metrics that match goals, and the habits that make analytics useful rather than overwhelming.
What analytics are for
Analytics serve four main purposes for creators:
- Understanding the audience: who is watching, where they come from, when they are online, what else they watch, and what they want.
- Improving content: which hooks keep people watching, which topics bring new viewers, which formats lead to follows, shares and saves, and where people lose interest.
- Making business decisions: which platforms deserve the most effort, which products or sponsors fit the audience, what to charge, and whether a project is worth continuing.
- Reporting and accountability: showing brand partners, collaborators, employers or funders what content achieved, with evidence.
In each case, the point is a decision. A number that does not change what you do next is trivia. A useful way to approach any dashboard is to ask, before looking: what decision am I trying to make, and what would I need to see to make it?
Data, metrics, insights and decisions
It helps to separate four levels:
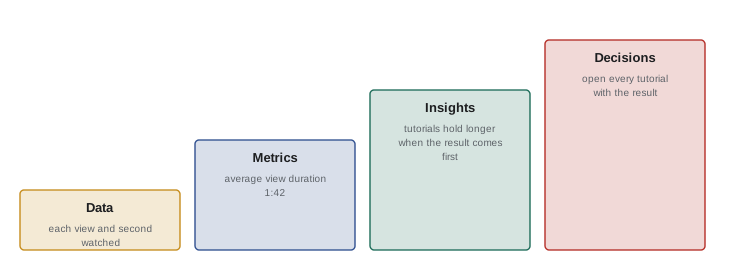
- Data are raw records: each view, each second watched, each click, each comment, with a time and some anonymized information about the viewer.
- Metrics are calculated summaries of data: total views, average view duration, engagement rate, follower growth. Each metric is defined in a particular way, and definitions differ between platforms and change over time (Lesson 2).
- Insights are interpretations of metrics in context: for example, "Tutorials published on Tuesday mornings hold viewers 40 % longer than vlogs, mainly because the first 10 seconds state the result clearly."
- Decisions are actions based on insights: "Open every video by showing the result first, and test moving vlogs to the same slot."
Most creators spend too much time at the metrics level, refreshing view counts, and too little time turning metrics into insights and decisions. A weekly or monthly review that ends with two or three concrete decisions is worth more than hours of watching numbers change.
Questions analytics can and cannot answer
Analytics are good at answering descriptive questions: what happened, how much, when and where. How many people watched? How long did they stay? Which videos brought the most new subscribers? Which countries do viewers come from? They are reasonably good at answering comparative questions: did this video do better or worse than my usual, and on which metrics? They are weaker at answering causal questions: why did this video do better? Was it the topic, the thumbnail, the time of posting, a trend, a share by a larger account, or luck? Causal questions need careful comparison, controlled experiments (Lesson 10) and judgement, because many things change at once.
Analytics cannot tell you directly what content you should make, whether your work is meaningful, or what your audience will want in a year. They describe the past behaviour of people who saw your content, not of people who never did. They do not measure many things that matter, such as trust, the quality of attention, or the effect of content on people's lives, except through rough proxies like comments and messages. Good creators combine numbers with qualitative evidence, such as reading comments, talking to viewers, running polls and watching how people use their content, and with their own creative judgement.
Vanity metrics and actionable metrics
A vanity metric is one that looks impressive but does not guide decisions or reflect real progress: total follower count, lifetime views, or likes on a single viral post. They are not useless, since brands may look at them and they feel good, but they can mislead. A large follower count built from one viral moment may contain many people who never watch again. Actionable metrics connect clearly to goals and to choices the creator can make: the share of viewers still watching at 30 seconds, the percentage of viewers who are new, follows per thousand views, click-through rate on a newsletter link, revenue per thousand views. The same number can be vanity or actionable depending on the question: views are vanity if you chase them blindly, but actionable if you compare them across topics to decide what to make next.
| Goal | Vanity metric | More actionable metric |
|---|---|---|
| Grow an engaged audience | Total followers | Follows per 1,000 views; returning viewers |
| Improve video quality | Lifetime views | Retention at key points; average percentage viewed |
| Build a business | Likes | Revenue per 1,000 views; conversion rate |
| Attract sponsors | Peak viral views | Typical (median) views and audience fit |
| Build community | Comment count alone | Returning commenters; replies; messages |
Matching metrics to goals
Different creators, and the same creator at different times, have different goals, and the right metrics follow from the goal. A new creator testing ideas might focus on early retention and shares, which indicate whether content resonates. A creator building a newsletter might focus on link clicks and subscribers rather than views. An educator might value saves, completion and comments with questions. A creator selling products might track traffic to their shop and conversion. A brand-funded channel might focus on audience demographics and the reach of sponsored content. Writing down goals and two or three key metrics for each goal, sometimes called key performance indicators (KPIs), keeps analysis focused.
Worked problem
Choosing KPIs for a cooking channel
A creator runs a cooking channel on YouTube and Instagram. Over the next six months, they want to grow a loyal audience and launch a paid recipe e-book. Which three KPIs should they track, and why?
Show solution
- Loyal audience: returning viewers per month on YouTube, because loyalty means people come back.
- Content that resonates: saves per 1,000 reach on Instagram Reels, since recipes are saved by people who intend to cook them.
- E-book readiness: email sign-ups per 1,000 views, since an email list is the most reliable channel for a product launch.
- Review these monthly, alongside a few qualitative signals such as comments saying "I made this".
Answer: Returning viewers, saves per 1,000 reach and email sign-ups per 1,000 views, each tied directly to a goal.
Normalizing: rates rather than totals
Raw totals are hard to compare because they depend on how many people saw the content. A video with 50,000 views and 2,000 likes is not necessarily better than one with 5,000 views and 400 likes; per view, the second performed twice as well. Normalizing turns totals into rates: per view, per impression, per 1,000 people reached, or per follower. Rates make it possible to compare content of different sizes, platforms of different scales and periods with different activity. Throughout this course, most useful metrics are rates or averages. When totals are used, such as total watch time or revenue, they are best compared with similar content over similar periods.
Typical performance and outliers
Social media performance is highly uneven: most posts perform within a typical range, while a few perform far better, and occasionally one goes viral. Because of this, averages (means) are easily distorted by a single outlier. If nine videos get 2,000 views and one gets 200,000, the mean is about 21,800 views, which describes none of the videos. The median, the middle value when results are sorted, is 2,000 views and describes a typical video far better. Creators should know their median performance on key metrics and compare new content with it, rather than with their best-ever result. Brands increasingly ask for median or typical views for the same reason (Lesson 11). Lesson 9 shows how to calculate these in a spreadsheet.
Time windows and patience
Content performs on different timescales. A short video may receive most of its views in the first 48 hours; a search-driven tutorial may receive steady views for years; a podcast episode may grow slowly as listeners catch up. Comparing a post after two hours with another after two weeks is meaningless. Use consistent windows, such as first 24 hours, first 7 days and first 28 days, when comparing content, and be patient before judging. Many platforms also update numbers with delays, sometimes adjusting counts after filtering invalid traffic, so early numbers can change.
Healthy habits with analytics
Constant checking of numbers can harm creativity and wellbeing. Research and creator experience suggest that obsessive monitoring increases anxiety and leads to chasing short-term spikes at the expense of long-term quality. Healthy habits include setting specific times to review analytics, such as a short check two days after posting and a longer review each week or month; turning off real-time notifications for views and likes; focusing reviews on a few KPIs and decisions; keeping a simple log of what was tried and what happened; and remembering that numbers describe content performance, not personal worth. CRE-350 covers creator wellbeing in more depth.
Course overview
Lesson 2 examines how metrics are defined and the pitfalls of comparing them; Lesson 3 covers reach, impressions and views; Lesson 4, engagement metrics; Lesson 5, retention curves; Lesson 6, traffic sources and discovery; Lesson 7, audience analytics; Lesson 8, revenue analytics; Lesson 9, spreadsheets and dashboards; Lesson 10, experiments and A/B tests; Lesson 11, reporting to brands and media kits; and Lesson 12, data ethics, privacy and a capstone analytics review.
Analytics across a creator's career
The metrics that matter change as a creator develops. In the first months, numbers are small and noisy, and the most useful signals are qualitative: whether strangers comment, whether anyone shares, whether retention in the first seconds is improving. As an audience forms, baselines become meaningful and patterns across topics and formats emerge. As the work becomes a business, revenue per piece of content, conversion to owned channels such as email, and audience fit for sponsors become central. Established creators often shift attention from growth to loyalty and sustainability: returning viewers, membership churn, and the health of the community. Revisiting goals and KPIs every few months keeps analytics aligned with the stage of the work.
Analytics for teams
When a creator works with editors, managers, assistants or agencies, analytics become a shared language. Agreeing on definitions, KPIs and a single source of truth, usually a shared spreadsheet or dashboard, prevents confusion. Team members should have access through official role-based permissions rather than shared passwords (Lesson 12). Regular review meetings that look at a few agreed metrics, discuss what was learned and decide what to try next help teams improve together, while avoiding the trap of blaming individuals for numbers influenced by many factors outside anyone's control.
Qualitative signals alongside numbers
Some of the most valuable evidence about content never appears on a dashboard: a viewer's message saying a video helped them through a difficult week, a teacher who uses tutorials in class, a stranger who recognizes the creator in a shop. Keeping a simple file of such messages and moments, alongside the numbers, reminds creators why the work matters and offers concrete examples of impact for sponsors, grant applications and portfolios. Numbers show scale; stories show meaning. Both belong in a creator's understanding of how content is doing.
Above all, analytics should serve the work rather than the other way round. A creator who understands their numbers but still makes content from curiosity and care tends to build something more durable than one who chases every metric.
Common mistakes
MistakeChecking numbers constantly without decisions.
InsteadReview at set times and end with concrete actions.
MistakeChasing vanity metrics.
InsteadTrack metrics tied to goals.
MistakeComparing totals across different-sized posts.
InsteadNormalize to rates per view or reach.
MistakeComparing new posts with your best-ever result.
InsteadCompare with your median performance.
MistakeTreating analytics as the answer to why.
InsteadCombine data with experiments, comments and judgement.
Summary and key terms
- Analytics exist to support decisions about audience, content and business.
- Data become metrics, metrics become insights, insights become decisions.
- Analytics describe what happened better than why it happened.
- Vanity metrics impress; actionable metrics guide choices.
- Choose a few KPIs for each goal.
- Use rates, medians and consistent time windows for fair comparisons.
- Healthy review habits protect creativity and wellbeing.
- Analytics
- Measurement and analysis of content performance.
- Metric
- Calculated summary of data.
- Insight
- Interpretation of metrics in context.
- KPI
- Key performance indicator tied to a goal.
- Vanity metric
- Impressive-looking number that does not guide decisions.
- Actionable metric
- Metric connected to goals and choices.
- Normalization
- Converting totals into rates for comparison.
- Median
- Middle value of sorted results.
- Outlier
- Result far from the typical range.
- Time window
- Fixed period for comparing performance.
Practice problems
Work each problem on paper first, then reveal the answer to check.
Name the four purposes of analytics.
Show answer
Audience, content, business decisions, reporting.
What is the difference between a metric and an insight?
Show answer
A metric summarizes data; an insight interprets it in context.
Which kind of question do analytics answer least well?
Show answer
Why something happened.
Give a vanity metric.
Show answer
Total followers or lifetime views.
Give an actionable metric for growth.
Show answer
Follows per 1,000 views.
Likes per 1,000 views: 300 likes on 12,000 views?
Show answer
25.
Why prefer the median to the mean?
Show answer
Outliers distort the mean.
Median of 2, 3, 3, 4 and 90 thousand views?
Show answer
3,000.
Why use consistent time windows?
Show answer
Content accumulates views over time.
Name a healthy analytics habit.
Show answer
Set review times, turn off notifications, focus on KPIs.
Lesson quiz · 5 questions
Score 60% or more to complete this lesson.
Create a free account to save your progress, take quizzes and earn a certificate.