
CRE-202 · Lesson 6 of 12 · 27 min
Traffic sources, click-through and attribution
Knowing where viewers come from is as important as knowing how many there are. A video watched mostly through search behaves differently from one pushed by recommendations; a newsletter sign-up from a short video means something different from one from a podcast mention. Traffic source reports show how people found content, click-through rates show how well packaging converts exposure into views, and attribution connects content to outcomes elsewhere, such as website visits and sales. This lesson covers traffic sources on major platforms, click-through rate and how to read it, packaging and expectation, external traffic and tracked links, UTM parameters, attribution models, cross-platform journeys, and using traffic data to plan content.
Traffic sources
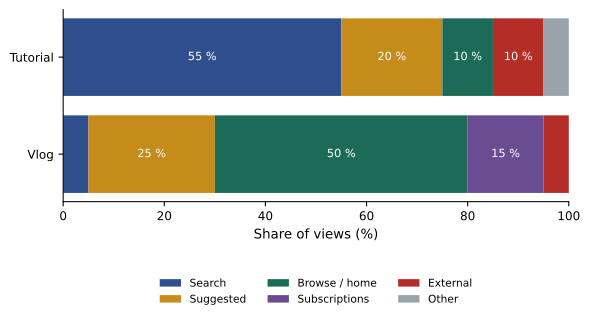
Platforms classify views by how viewers arrived. Typical categories include:
- Recommendation feeds: home feeds, For You pages, Explore, Reels and Shorts feeds, and suggested or "up next" videos beside other content.
- Search: platform search and, for some platforms, external search engines.
- Following and subscriptions: feeds or tabs showing accounts the viewer follows, and notifications.
- Profile or channel pages: viewers browsing the creator's own profile.
- External: links and embeds on websites, messaging apps and other platforms.
- Playlists, hashtags, sounds and other features, depending on the platform.
Each source reflects a different viewer intention. Search viewers are looking for something specific; recommendation viewers were offered content they did not request; subscription viewers already know and like the creator. A channel heavily dependent on one source is vulnerable to changes in that source, whether a recommendation system update or declining search demand.
| Source | Viewer intent | What it suggests | Content that benefits |
|---|---|---|---|
| Recommendations | Open to something interesting | Content appeals broadly and holds attention | Entertaining, engaging, broadly relevant |
| Search | Looking for a specific answer | Content matches demand | Tutorials, reviews, explainers |
| Subscriptions / following | Loyal to the creator | Strong relationship | Series, personality-driven content |
| External | Arrived from elsewhere | Shared or linked | Useful, newsworthy, embeddable |
| Profile / channel | Exploring the creator | Interest after discovery | Clear identity, organized playlists |
Click-through rate
On platforms where viewers choose content from a thumbnail or preview, such as YouTube, click-through rate (CTR) measures the share of impressions that led to a view. YouTube calls this impressions click-through rate. CTR depends on the thumbnail, title, topic, the viewer's relationship with the channel and where the impression appeared. It is highest among subscribers and in search, where intent is strong, and lower on the home feed, where viewers are browsing. Crucially, CTR usually falls as a video is shown to wider audiences: early impressions go to subscribers and the most likely viewers, and later impressions go to people less familiar with the creator. A falling CTR over a video's life is normal, as CRE-201 explained, and a lower CTR on a video with vastly more impressions may still mean more views.
Worked problem
Reading CTR with impressions
Video A had 50,000 impressions with 8 % CTR. Video B had 400,000 impressions with 4 % CTR. Which performed better at attracting viewers, and what does the difference in CTR suggest?
Show solution
- Views from impressions, A: 50,000 × 0.08 = 4,000.
- Views from impressions, B: 400,000 × 0.04 = 16,000.
- B attracted four times as many viewers despite half the CTR.
- B's lower CTR reflects being shown to a much wider, less familiar audience, not weaker packaging.
Answer: Video B, with 16,000 views; its lower CTR is expected at eight times the impressions.
Packaging and expectation
Thumbnails, titles, captions and first frames form the packaging that persuades people to watch. Good packaging accurately promises what the content delivers and makes that promise appealing. Analytics help evaluate packaging by combining CTR with early retention: high CTR with strong early retention means the packaging attracted the right viewers and the content delivered; high CTR with poor retention suggests the packaging overpromised or misled; low CTR with strong retention suggests good content with weak packaging, a prime candidate for a new thumbnail or title. Many creators revisit packaging on older videos that have strong retention but low CTR, sometimes reviving them. Lesson 10 covers testing packaging with built-in tools such as YouTube's Test and Compare.
| CTR | Early retention | Interpretation | Action |
|---|---|---|---|
| High | High | Packaging and content aligned | Repeat the approach |
| High | Low | Packaging overpromised | Make packaging accurate or open faster |
| Low | High | Good content, weak packaging | Test new thumbnail and title |
| Low | Low | Topic or execution not resonating | Rethink idea and opening |
External traffic and tracked links
Many creators want audiences to move beyond the platform: to a newsletter, website, shop, course or another platform. Measuring this requires tracking links. Simple approaches include link-in-bio tools and link shorteners that count clicks for each link; more precise approaches use UTM parameters, tags added to the end of a URL that web analytics tools such as Google Analytics read to identify where a visitor came from. A typical UTM-tagged link includes the source (for example, instagram), the medium (for example, social or bio), and the campaign (for example, spring-recipe-book), and may include content to distinguish posts. Using consistent naming conventions for UTM tags, documented in a spreadsheet, makes reports reliable. Some platforms remove or limit external links, and in-app browsers or privacy features can strip tracking information, so link data are always incomplete.
Attribution
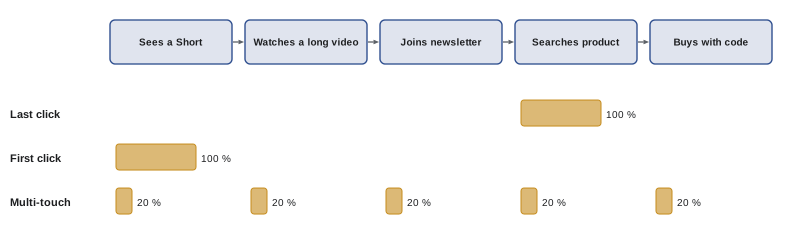
Attribution assigns credit for an outcome, such as a sale or sign-up, to the content and channels that contributed. Simple models give all credit to the last click before the outcome (last-click attribution) or the first interaction (first-click attribution). Multi-touch models spread credit across several interactions. For creators, attribution is often imprecise: a viewer may see several short videos, watch a long video, read a newsletter, then search for the product and buy it days later on a different device. Last-click attribution would credit the search, ignoring the content that built interest. Practical tools for creators include unique discount codes for each platform or campaign, dedicated landing pages, tracked links, post-purchase surveys asking "how did you hear about us?", and affiliate dashboards. Combining these gives a reasonable, if imperfect, picture.
Cross-platform journeys
Audiences rarely stay on one platform. Short-form videos often introduce people to a creator, who then watch long videos, listen to podcasts, join newsletters or communities, and eventually buy products. Platform analytics show only the part of the journey on that platform. Creators can piece together the whole journey by asking new subscribers and customers where they first found them, tracking which platform's links bring the most valuable visitors, comparing the timing of spikes on different platforms after a big post, and noting comments such as "found you on TikTok". This picture helps decide which platforms play which roles: discovery, deepening the relationship, or conversion.
Using traffic data to plan content
Traffic source data inform strategy. A channel whose views come mostly from search can plan content around search demand, using keyword research and evergreen topics (CRE-201 Lesson 8). A channel dependent on recommendations should focus on hooks, retention and broad appeal, and on diversifying sources to reduce risk. A channel with strong subscription traffic has a loyal audience that may support memberships, products or series. External traffic reveals which communities share the content and which websites embed it, suggesting partnerships. Tracking each video's traffic mix over time also shows how a video's life evolves: many videos start with subscriber traffic, move to recommendations, and settle into search.
External traffic sources in detail
External traffic often comes from messaging apps, social platforms, websites, forums and search engines. Platforms report external traffic with varying detail; YouTube, for example, identifies some referring websites and apps. External traffic is valuable because it often comes from personal recommendations, such as a link shared in a group chat or a community forum, which brings engaged viewers. A sudden spike in external traffic may reveal that a news site, a popular newsletter or a large community has linked to your content, an opportunity to engage with that community or create follow-up content.
Email and newsletter metrics
For creators with newsletters, email analytics complement social analytics. Key metrics include list size, growth and unsubscribe rate; click rate, the share of recipients who click at least one link; click-to-open rate where open data are reliable; replies; and conversions from email to products or content. Because of privacy features that pre-load images, open rates have become unreliable for many recipients, so clicks and replies are more trustworthy measures of engagement. Tracking which social posts bring new subscribers, through tracked sign-up links or source fields on sign-up forms, connects social content to the email list.
Worked problem
Comparing sources of email sign-ups
In a month, a creator gets 300 email sign-ups from YouTube descriptions (from 150,000 views), 180 from Instagram link stickers (from 60,000 story views) and 120 from a podcast mention (from 8,000 downloads). Which source converts best per 1,000 exposures?
Show solution
- YouTube: 300 ÷ 150,000 × 1,000 = 2 sign-ups per 1,000 views.
- Instagram stories: 180 ÷ 60,000 × 1,000 = 3 per 1,000.
- Podcast: 120 ÷ 8,000 × 1,000 = 15 per 1,000 downloads.
Answer: The podcast converts best at 15 per 1,000, then Instagram stories at 3 and YouTube at 2.
Offline and indirect effects
Some effects of content are hard to measure: viewers who remember a product and buy it in a shop months later, people who recommend a creator to friends in conversation, or audiences who search for a creator's name after seeing them on another platform. Increases in branded search, the number of people searching for a creator's name, and direct traffic to a website can indicate these indirect effects. Brand lift studies, in which platforms or brands survey exposed and unexposed groups about awareness and attitudes, measure effects that clicks cannot, and are sometimes available for larger sponsored campaigns.
Building a traffic report
A monthly traffic report might include, for each platform, the share of views by source; the top search terms; the top external referrers; click-through rate by surface; link clicks and email sign-ups by source; and notes on changes. Over time, this report reveals whether discovery is becoming more diversified or more dependent on one source, and which content brings people into the deeper parts of the funnel.
Traffic sources for short-form platforms
Short-form platforms report traffic sources in simpler terms. TikTok shows the share of views from the For You feed, the creator's profile, the Following feed, search, sounds and other sources; Instagram shows reach from Reels, Explore, home feed, profile and other surfaces. A healthy short-form account typically receives most views from recommendation feeds, with profile visits indicating that viewers became curious about the creator. A rising share from search on short-form platforms reflects their growing use as search engines, especially among younger users, and suggests that captions, on-screen text and spoken keywords matter (CRE-201 Lesson 8).
Click-through rate on other surfaces
Click-through rates also apply beyond thumbnails: link clicks from a newsletter, taps on a link sticker in a story, clicks on an affiliate link in a description, and taps on a product tag in a post. Each has its own typical range, and comparing a new post with your baseline for the same surface is more useful than comparing with other surfaces. Improving these rates often depends on clear placement, a strong reason to click and a destination that delivers what was promised.
Diagnosing a drop in search traffic
When search traffic falls, check whether demand for the topic has fallen using search trend tools, whether competing content now ranks above yours, whether titles and descriptions still match how people search, and whether the content has become outdated. Updating titles, descriptions, chapters and pinned information, or publishing a refreshed version, can restore search performance for evergreen topics.
Traffic and audience quality
Not all traffic is equally valuable. Viewers arriving from a relevant community, a trusted recommendation or a specific search often watch longer, engage more and are more likely to subscribe or buy than viewers who arrived through a broad recommendation feed or a viral moment. Comparing retention, follows and conversions by traffic source shows which sources bring the most valuable audiences. A smaller amount of high-quality traffic can be worth more than a large amount of casual traffic, especially for creators whose business depends on trust, products or memberships.
Common mistakes
MistakeJudging packaging by CTR alone.
InsteadRead CTR with impressions and early retention.
MistakePanicking when CTR falls over time.
InsteadExpect CTR to fall as impressions widen.
MistakeUntracked external links.
InsteadUse tracked links and consistent UTM tags.
MistakeCrediting only the last click.
InsteadUse codes, surveys and multi-touch thinking.
MistakeDepending on a single traffic source.
InsteadDiversify sources and platforms.
Summary and key terms
- Traffic sources reveal how viewers found content and their intent.
- CTR measures views per impression and falls as audiences widen.
- Read CTR together with impressions and early retention.
- Good packaging accurately and attractively promises the content.
- Tracked links and UTM parameters measure off-platform traffic.
- Attribution is imperfect; combine codes, links, surveys and dashboards.
- Use traffic data to plan content and diversify sources.
- Traffic source
- How viewers arrived at content.
- Browse features
- YouTube home feed and related surfaces.
- Suggested videos
- Recommendations beside or after other videos.
- Click-through rate
- Share of impressions leading to views.
- Packaging
- Thumbnail, title and first frames that attract viewers.
- UTM parameters
- URL tags identifying source, medium and campaign.
- Attribution
- Assigning credit for outcomes to interactions.
- Last-click attribution
- All credit to the final interaction.
- Multi-touch attribution
- Credit spread across interactions.
- Discount code
- Unique code that tracks purchases from a campaign.
Practice problems
Work each problem on paper first, then reveal the answer to check.
Name four traffic sources.
Show answer
Recommendations, search, subscriptions, external, profile, playlists.
What intent do search viewers have?
Show answer
Looking for something specific.
CTR for 3,000 views from 60,000 impressions?
Show answer
5 %.
Why does CTR fall over a video's life?
Show answer
Impressions reach less familiar audiences.
What does high CTR with low retention suggest?
Show answer
Overpromising packaging.
What should you do with low CTR and high retention?
Show answer
Test new packaging.
Name the three main UTM parameters.
Show answer
Source, medium, campaign.
What is last-click attribution?
Show answer
Giving all credit to the final interaction.
Name two attribution tools for creators.
Show answer
Discount codes, landing pages, tracked links, surveys.
Why diversify traffic sources?
Show answer
To reduce vulnerability to changes in one source.
Lesson quiz · 5 questions
Score 60% or more to complete this lesson.
Create a free account to save your progress, take quizzes and earn a certificate.