
CRE-202 · Lesson 8 of 12 · 29 min
Revenue analytics
For creators who earn a living, the most important numbers are often those that measure money: advertising revenue, sponsorship income, affiliate commissions, memberships, product sales and the costs of producing content. Revenue analytics connect audience and content metrics to income, showing which content, platforms and products are most valuable, and whether the business is sustainable. This lesson covers revenue streams and their metrics, CPM and RPM, what drives advertising rates, short-form and long-form revenue, sponsorship value, affiliate and product conversion, memberships and subscriptions, lifetime value and churn, costs and profit per piece of content, and revenue concentration and risk. CRE-302 covers monetization strategies in depth; this lesson focuses on measurement.
Revenue streams and their metrics
Each revenue stream has its own key metrics:
| Revenue stream | Key metrics | Where data come from |
|---|---|---|
| Platform advertising revenue | RPM, CPM, monetized playbacks, revenue per video | Platform monetization dashboards |
| Sponsorships | Fee per deliverable, cost per view or click for the brand, repeat rate | Contracts, campaign reports |
| Affiliate links | Clicks, conversion rate, commission per click | Affiliate network dashboards |
| Memberships and subscriptions | Members, churn, revenue per member | Platform or membership tools |
| Digital and physical products | Conversion rate, average order value, refunds | Shop and payment platforms |
| Tips, gifts and live features | Revenue per stream hour, top supporters | Live dashboards |
| Licensing and services | Fees, clients, repeat business | Invoices, contracts |
Tracking revenue by stream, by platform and by month in one spreadsheet (Lesson 9) gives a full picture, since no single dashboard shows everything.
CPM and RPM
Two related measures describe advertising revenue. CPM (cost per mille, or cost per thousand impressions) is what advertisers pay for 1,000 ad impressions before the platform takes its share. RPM (revenue per mille) is what the creator earns per 1,000 views, after the platform's share and including all views, not just those with ads, and usually including other platform revenue such as memberships. RPM is lower than CPM because not every view shows an ad, some viewers use ad blockers or premium subscriptions, and the platform keeps a share of advertising revenue. On YouTube, creators in the partner programme typically receive 55 % of net advertising revenue from long-form videos, and 45 % of their allocated share of the Shorts revenue pool.
Worked problem
Estimating advertising revenue
A creator's long-form videos have an RPM of $6.50. A new video receives 120,000 views in its first month. How much advertising revenue is expected? If the creator's Shorts have an RPM of $0.08, how many Shorts views would produce the same revenue?
Show solution
- Long-form revenue: 120,000 ÷ 1,000 × $6.50 = $780.
- Shorts views needed: $780 ÷ $0.08 × 1,000 = 9,750,000 views.
- Shorts would need about 81 times as many views to earn the same advertising revenue.
Answer: About $780 from the long-form video; roughly 9.75 million Shorts views would be needed to match it at that RPM.
What drives advertising rates
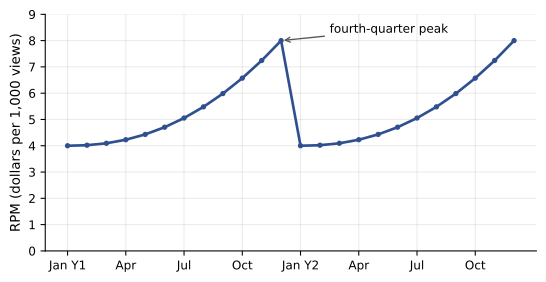
Advertising rates vary widely. Key factors include the audience's country, since advertisers pay much more to reach viewers in wealthy markets such as the United States, Canada, the United Kingdom and Australia than in lower-income markets; the topic or niche, since advertisers in finance, technology, business and software pay more than those targeting entertainment or general interest; the time of year, since rates typically rise in the fourth quarter before the holidays and fall in January; video length, since long-form videos of eight minutes or more can include mid-roll ads; audience age, since some advertisers avoid very young audiences, and content made for children has restricted advertising; and advertiser-friendliness, since content with violence, profanity or sensitive topics may receive limited ads. Because of these factors, RPM figures are only meaningful when compared within the same niche and audience geography.
Short-form and long-form revenue
Short-form video generally earns far less advertising revenue per view than long-form video, because ads are shown between videos in feeds and revenue is pooled and shared across creators rather than attached to individual videos. Short-form content often has greater value as a discovery channel, bringing viewers who later watch long-form videos, join newsletters or buy products. Revenue analytics should therefore consider indirect value: subscribers gained from shorts who later watch long-form content, or traffic to products. Comparing revenue per hour of production effort, rather than per view, gives a fairer picture of which formats sustain the business.
Sponsorship value
For many creators, sponsorships are the largest source of income. Sponsorship metrics matter both to the creator and to the brand. Brands evaluate the expected reach and impressions of sponsored content, audience fit, engagement, clicks and conversions, and the effective cost per thousand views (CPV or CPM) or per click compared with other advertising. Creators should know their typical (median) views per sponsored integration, the engagement and click rates on past sponsored content, and the results brands achieved, which support pricing and renewals. A useful internal metric is effective sponsorship revenue per 1,000 views, which can be compared with advertising RPM to see how much more valuable sponsorship is. Lesson 11 covers reporting to brands; CRE-310 covers pricing and negotiation.
Affiliate and product conversion
Affiliate links and product sales depend on conversion: the share of people who click and then buy. Key metrics include click-through rate on links, conversion rate from click to purchase, average order value, commission rate, earnings per click (EPC) and refund or return rates. Comparing EPC across products and platforms shows which recommendations are most valuable to the audience and the creator. For a creator's own products, such as e-books, courses, presets or merchandise, conversion from email lists is usually much higher than from social posts, which is why email sign-ups are often a key metric. Tracking sales by source with discount codes and UTM-tagged links (Lesson 6) shows which content drives purchases.
Memberships, subscriptions and churn
Recurring revenue from memberships on YouTube or Patreon, paid newsletters, subscription communities and similar models is valuable because it is predictable. The key metrics are the number of paying members, average revenue per member, new members per month, and churn, the share of members who cancel each month. Lifetime value (LTV), the total revenue an average member generates before leaving, can be estimated from revenue per member and churn. Reducing churn by delivering consistent value to members often increases revenue more effectively than attracting new members.
Worked problem
Membership lifetime value
A creator has 800 members paying an average of $6 a month after platform fees. Each month about 5 % cancel. What is the estimated lifetime value per member, and how many new members per month are needed to keep membership stable?
Show solution
- LTV ≈ $6 ÷ 0.05 = $120 per member.
- Monthly cancellations: 800 × 0.05 = 40 members.
- To stay stable, the creator needs about 40 new members per month.
- Reducing churn to 4 % would raise LTV to $150 and lower the replacement need to 32 per month.
Answer: LTV is about $120; about 40 new members a month keep membership stable.
Costs and profit per piece of content
Revenue alone does not show whether content is worthwhile. Costs include equipment, software subscriptions, editors, assistants, travel, props, studio space, music licences and the creator's own time. Calculating approximate revenue and cost per piece of content, or per series, shows which content is profitable. A travel video that earns $3,000 but costs $4,000 in travel and editing loses money unless it builds long-term value; a simple tutorial that earns $500 and costs $100 may be more sustainable. Including an estimate of the creator's time at a reasonable hourly rate gives a more honest picture. Lifetime revenue matters too: evergreen videos may earn for years, so early revenue understates their value.
Revenue concentration and risk
Many creators depend heavily on one platform or one revenue stream, which creates risk: a change in a platform's recommendation system, monetization policy or partner programme, or the loss of a major sponsor, can cut income suddenly. Revenue analytics should track concentration: the share of income from the largest platform, the largest stream and the largest client. A common rule of thumb in business is that dependence on any single client or channel for more than about a third or half of income deserves attention. Diversifying revenue, building owned channels such as email lists, and keeping savings for lean months reduce risk (CRE-302 and CRE-330).
Platform creator funds and bonus programmes
Beyond advertising revenue sharing, some platforms pay creators through funds, bonus programmes and rewards based on views, engagement or qualifying content, such as programmes for longer videos, series or original content. Payment rates vary over time, by country and by eligibility, and programmes are frequently changed or discontinued. Creators should track revenue from each programme separately, calculate revenue per 1,000 qualifying views, and avoid relying on them as a stable income source.
Live revenue
Live streaming generates revenue through tips, paid messages, virtual gifts, subscriptions and live shopping. Useful metrics include revenue per stream hour, revenue per concurrent viewer, the share of revenue from the top supporters and the conversion rate from viewers to paying supporters. Because a small number of supporters often provide most live revenue, creators should consider concentration and the wellbeing of supporters who may spend heavily, and avoid pressuring audiences.
Revenue dashboards and taxes
A monthly revenue summary, by stream and platform, with year-to-date totals and comparisons with the previous year, supports both planning and tax obligations. Platforms provide payment reports and tax forms, and income must generally be reported in the creator's country of residence; currency conversion and foreign tax withholding add complexity for creators paid by platforms in other countries. CRE-330 covers business accounting and taxes in depth; from an analytics perspective, the key is recording revenue consistently with dates, sources and currencies.
Worked problem
Revenue mix and concentration
In a year, a creator earns $24,000 from YouTube advertising, $30,000 from sponsorships (of which $18,000 from one brand), $6,000 from affiliates and $12,000 from memberships. What share comes from sponsorships, and from the largest single client?
Show solution
- Total revenue: 24,000 + 30,000 + 6,000 + 12,000 = $72,000.
- Sponsorships: 30,000 ÷ 72,000 ≈ 41.7 %.
- Largest client: 18,000 ÷ 72,000 = 25 %.
Answer: Sponsorships are about 42 % of revenue and the largest client 25 %, moderate concentration worth monitoring.
Forecasting revenue
Simple forecasts help plan budgets and investments. A basic approach multiplies expected views by RPM for advertising, adds confirmed sponsorships and expected recurring revenue from memberships after churn, and applies a conservative factor for uncertain sources. Comparing forecasts with actual results each month improves forecasting over time. Because creator income is volatile, planning with a range, such as low, expected and high scenarios, is safer than a single number.
Revenue per hour of work
A revealing way to compare content types is revenue per hour of work. A long-form documentary that took 80 hours and earned $2,400 yields $30 per hour; a series of quick tutorials that took 10 hours and earned $600 yields $60 per hour, even though it earned less in total. Including all revenue linked to a piece, such as advertising, affiliate commissions and sponsorships, and all time spent, from research to editing and community management, gives a fuller picture. Content with lower hourly returns may still be worthwhile for growth, reputation or creative fulfilment, but the calculation makes trade-offs visible.
Currency and international revenue
Creators with international audiences and partners often receive payments in several currencies. Recording revenue in the original currency and in your home currency at the exchange rate on the payment date keeps records accurate, and exchange rate changes can noticeably affect income for Canadian creators paid in US dollars, or vice versa.
Taken together, these measures give a clear, honest picture of whether content sustains the creator as well as the audience.
Common mistakes
MistakeConfusing CPM with RPM.
InsteadUse RPM for what you earn per 1,000 views.
MistakeComparing RPM across different niches and countries.
InsteadCompare within similar audiences.
MistakeJudging shorts only by direct revenue.
InsteadCount discovery and indirect value.
MistakeIgnoring costs and time.
InsteadTrack profit per content piece or series.
MistakeDepending on one platform or sponsor.
InsteadMeasure concentration and diversify.
Summary and key terms
- Each revenue stream has its own metrics and data sources.
- CPM is advertiser cost; RPM is creator revenue per 1,000 views.
- Country, niche, season, length and suitability drive advertising rates.
- Short-form earns less per view but drives discovery.
- Sponsorship value can be expressed as effective CPM for brands.
- Conversion, EPC, churn and lifetime value measure products and memberships.
- Track costs, profit and revenue concentration.
- CPM
- Advertiser cost per 1,000 ad impressions.
- RPM
- Creator revenue per 1,000 views.
- Revenue share
- Split of advertising revenue between platform and creator.
- Mid-roll
- Ad shown during a video.
- Effective CPM
- Sponsorship fee per 1,000 views of sponsored content.
- Conversion rate
- Share of clicks that become purchases.
- EPC
- Earnings per click on affiliate links.
- Churn
- Share of members cancelling per period.
- Lifetime value
- Total revenue from an average customer or member.
- Revenue concentration
- Dependence on one source of income.
Practice problems
Work each problem on paper first, then reveal the answer to check.
Why is RPM lower than CPM?
Show answer
Not all views show ads, and the platform takes a share.
Revenue from 80,000 views at RPM $5?
Show answer
$400.
Name three factors that raise advertising rates.
Show answer
Wealthy countries, finance/tech niches, Q4, long videos.
Why do shorts earn less per view?
Show answer
Ads run between videos and revenue is pooled.
Effective CPM of a $2,000 sponsorship with 50,000 views?
Show answer
$40.
EPC for $300 commission from 1,500 clicks?
Show answer
$0.20.
LTV for $10 a month and 8 % churn?
Show answer
$125.
What does churn measure?
Show answer
Share of members cancelling each period.
Why include time in content costs?
Show answer
For an honest view of profitability.
What is revenue concentration risk?
Show answer
Dependence on one platform, stream or client.
Lesson quiz · 5 questions
Score 60% or more to complete this lesson.
Create a free account to save your progress, take quizzes and earn a certificate.