
CRE-340 · Lesson 9 of 12 · 30 min
Affiliate programs, attribution and incrementality
Every brand eventually asks the same question about its creator program: what did it actually cause? Tracking links and discount codes give a partial answer, counting sales that can be traced directly to a creator. But customers often see a creator post, think about it for a week, search for the brand and buy on another device, leaving no trace. Some tracked sales would have happened anyway. This lesson covers affiliate programs and tracking, attribution models that share credit across touchpoints, and incrementality methods such as holdout tests, lift studies and marketing mix models that estimate what the campaign truly added. It ends with the privacy rules that govern tracking.
Affiliate programs
An affiliate program pays creators a commission on sales or sign-ups they generate, tracked through unique links or codes. Affiliate programs can run on their own, as an always-on channel open to many creators, or as part of hybrid deals with selected creators. They are attractive because the brand pays only for tracked results, and they reward creators who genuinely drive sales.
Key design choices include the commission rate, often a percentage of sale value or a fixed amount per sign-up; whether commission applies to new customers only or to all purchases; the cookie window, the period after a click during which a purchase is credited, often 7 to 30 days; how returns and cancellations are handled; and how quickly commissions are paid. Brands should also set rules on where creators may promote links. Allowing creators to bid on the brand's own name in search ads, for example, lets affiliates claim credit for sales that would have happened anyway.
Discount codes are popular because they work across devices and in podcasts and videos where links are awkward. Their weakness is leakage: codes get posted on coupon websites and used by people who never saw the creator, so the creator is credited and the brand gives an unnecessary discount. Single-use or creator-specific codes with short expiry dates reduce leakage, and reviewing which codes show unusual spikes helps catch it.
Worked problem
Adjusting tracked sales for code leakage
A creator's code recorded 400 orders. The brand finds that about 25 % of redemptions came from a coupon website rather than the creator's audience, and its experience suggests that half of the remaining code users would have bought anyway because they were existing customers. Estimate the incremental orders.
Show solution
- Orders from the creator's audience: 400 × (1 − 0.25) = 300.
- Orders that would not have happened otherwise: 300 × 0.5 = 150.
Answer: About 150 incremental orders from 400 tracked, which changes the CPA by a factor of more than two.
Tracking links and UTMs
Links used in creator campaigns should carry tracking parameters so that the brand's web analytics can identify the source. The most common system uses UTM parameters added to the end of a URL, such as utm_source for the platform, utm_medium for the channel type, utm_campaign for the campaign name and utm_content to identify the individual creator or post. Consistent naming conventions matter: if one team writes "TikTok", another "tiktok" and a third "tt", reports will split the same traffic three ways. Short links make UTM-tagged URLs easier for creators to share and audiences to type.
Many brands also use affiliate or influencer platforms that generate unique links per creator and handle commission tracking, and some platforms offer native shopping features where purchases happen inside the app and are attributed automatically. Each system counts slightly differently, so expect totals from the platform, the affiliate tool and web analytics to disagree. Choose one as the source of truth for each KPI and explain the differences in reports.
Attribution models
Customers usually encounter a brand several times before buying: perhaps a creator video, then a search ad, then an email. Attribution models decide how to share credit for the sale among those touchpoints. Each model embodies a different assumption about what matters.
| Model | How credit is shared | Effect on creator credit |
|---|---|---|
| Last click | All credit to the final touchpoint before purchase | Usually undercounts creators, who often appear early |
| First click | All credit to the first touchpoint | Can overcount awareness channels |
| Linear | Equal credit to every touchpoint | Simple, but treats all touches as equal |
| Time decay | More credit to touchpoints closer to purchase | Moderately undercounts early touches |
| Position-based | Often 40 % first, 40 % last, 20 % shared among the middle | Credits both discovery and closing |
| Data-driven | Statistical model estimates each touchpoint's contribution | Depends on data quality; can be a black box |
Worked problem
Sharing credit for a sale
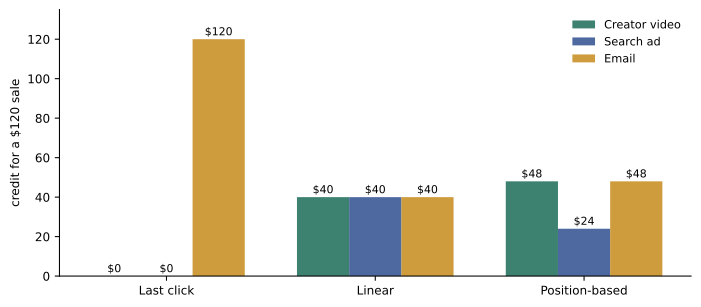
A customer saw a creator video, then clicked a search ad, then bought after opening an email. The order was worth $120. How much credit does the creator get under last-click, linear and 40-20-40 position-based models?
Show solution
- Last click: the email gets all $120; the creator gets $0.
- Linear: each of three touches gets 120 ÷ 3 = $40.
- Position-based: first touch (creator) 0.40 × 120 = $48; middle (search) 0.20 × 120 = $24; last (email) 0.40 × 120 = $48.
Answer: The creator receives $0, $40 or $48 of credit depending on the model.
Attribution models only reshuffle credit among touchpoints that were recorded. They miss impressions that left no click, they cannot tell whether a sale would have happened without any marketing, and they are increasingly limited by privacy restrictions on cross-site tracking. For creator marketing, where much of the effect comes from people who watched but did not click, attribution tends to undervalue the work. That is why serious programs add incrementality testing.
Incrementality and holdout tests
Incrementality asks what happened because of the campaign that would not have happened otherwise. The gold standard is a controlled experiment: split comparable people or places into a test group exposed to the campaign and a control group that is not, then compare outcomes. The difference, scaled to the test group's size, estimates the incremental effect.
For creator campaigns, individual-level control groups are hard because brands cannot stop specific people seeing organic posts. Practical options include geographic tests, where creator content is amplified or creators are recruited in some regions but not in matched others; platform lift studies, where the platform randomly withholds paid creator ads from a control group and surveys or tracks both groups; and time-based tests, which compare periods with and without activity but are weaker because other factors change over time.
Worked problem
Incrementality from a regional holdout
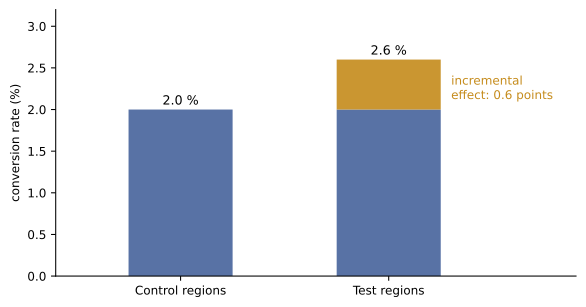
A brand amplifies creator content in test regions with 400,000 target customers and holds back matched control regions. Over four weeks, 2.6 % of test-region customers buy, against 2.0 % in control regions. The average order is $60 and the campaign cost $72,000. Estimate incremental orders, revenue and iROAS.
Show solution
- Lift in conversion rate: 2.6 % − 2.0 % = 0.6 percentage points, or 0.006.
- Incremental orders: 0.006 × 400,000 = 2,400.
- Incremental revenue: 2,400 × $60 = $144,000.
- iROAS: 144,000 ÷ 72,000 = 2.0.
Answer: About 2,400 incremental orders and $144,000 incremental revenue, an iROAS of 2.0; profit depends on margin, so at a 40 % margin the campaign roughly breaks even on first orders.
How big does a test need to be?
Small tests produce noisy results. A rough rule of thumb for comparing two conversion rates is that each group needs about n people, where p is the baseline conversion rate and d is the smallest absolute difference worth detecting. This approximation corresponds to about 80 % power at a 5 % significance level; statisticians use more precise formulas, but the rule shows why small lifts need large samples.
Worked problem
Sample size for a lift test
A brand's baseline conversion rate is 2 %, and it wants to detect a lift of 0.5 percentage points. Roughly how many people does each group need?
Show solution
- p(1 − p) = 0.02 × 0.98 = 0.0196.
- d² = 0.005² = 0.000025.
- n ≈ 16 × 0.0196 ÷ 0.000025 = 0.3136 ÷ 0.000025 ≈ 12,544.
Answer: About 12,500 people in each group; halving the detectable lift to 0.25 points would need about four times as many.
Brand lift and search lift
For awareness and consideration objectives, brand-lift studies survey people who were exposed to a campaign and a control group who were not, asking about awareness, ad recall, consideration and purchase intent. The difference between the groups estimates the lift. Several platforms offer brand-lift studies for paid campaigns, including paid creator content, often with minimum spend requirements. Search lift compares branded search volumes between exposed and unexposed groups or regions. Both measures capture effects that clicks miss.
Marketing mix modelling
Marketing mix modelling (MMM) uses statistical analysis of historical data, typically two or more years of weekly sales, spending by channel and outside factors such as seasonality, prices and competitor activity, to estimate how much each channel contributes to sales. MMM has regained popularity because it does not rely on tracking individuals and so is less affected by privacy restrictions. Open-source MMM tools have made it more accessible, but it still needs enough data and variation in spending to separate each channel's effect. For creator programs, MMM works best when creator spending is large enough and varies enough over time to be visible in the data. Many brands combine MMM for the big picture with experiments to calibrate it.
Privacy and tracking
Tracking customers across websites and apps involves personal information, and privacy laws limit what brands may do. Browser and device changes have also reduced third-party cookies and cross-app tracking, pushing brands towards first-party data, platform-reported results and aggregate methods such as MMM and experiments.
In Canada, PIPEDA requires meaningful consent for collecting, using and disclosing personal information, and the Office of the Privacy Commissioner has said that online behavioural advertising generally requires at least opt-out consent with clear notice, and express consent for sensitive information. Quebec's Law 25 goes further, requiring that technologies that identify, locate or profile people be turned off by default unless the person activates them, and requiring privacy impact assessments in some cases. Federal privacy reform has been proposed several times but, as of late 2026, PIPEDA remains in force; check for changes.
Practical steps include using consent tools on websites, sharing only aggregated or hashed data with platforms under proper agreements, avoiding sensitive categories such as health conditions in targeting without the required consent, and telling customers in privacy notices how campaign tracking works.
Choosing a measurement mix
No single method answers every question, so mature programs combine several. Tracked links and codes give fast, creator-level feedback for day-to-day optimization. Attribution models show how creators interact with other channels. Holdout and lift tests, run a few times a year, measure what the program truly adds and calibrate the faster metrics. Marketing mix models put creator spending in context with all other marketing over longer periods. The practical skill is knowing which tool answers which question and not asking a tracking link to prove incrementality or an MMM to judge an individual post.
Common mistakes
MistakeTreating tracked code redemptions as the campaign's full effect.
InsteadAdjust for leakage and baseline sales, and test incrementality.
MistakeJudging creators on last-click attribution alone.
InsteadCompare several models and add holdout or lift tests.
MistakeUsing inconsistent UTM naming.
InsteadAgree a naming convention and use it everywhere.
MistakeRunning lift tests too small to detect realistic effects.
InsteadEstimate sample size before testing.
MistakeIgnoring privacy law in tracking and retargeting.
InsteadObtain appropriate consent and minimize data sharing.
Summary and key terms
- Affiliate programs pay commission on tracked sales; design commission, cookie windows, returns and promotion rules carefully.
- Discount codes suffer leakage; use creator-specific, expiring codes and monitor spikes.
- UTM parameters with consistent naming identify traffic sources.
- Attribution models share credit differently; last click usually undercounts creators.
- Incrementality compares test and control groups: incremental conversions = (CRtest − CRcontrol) × Ntest.
- Rough sample size per group: n ≈ 16p(1 − p)/d².
- Brand lift, search lift and marketing mix models capture effects clicks miss, within privacy rules.
- Affiliate program
- A scheme paying commission on tracked sales.
- Cookie window
- Time after a click during which a sale is credited.
- Code leakage
- Discount codes used by people outside the creator's audience.
- UTM parameters
- Tags added to URLs to identify traffic sources.
- Attribution model
- A rule for sharing credit across touchpoints.
- Incrementality
- The effect that would not have happened without the campaign.
- Holdout group
- A control group deliberately not exposed to a campaign.
- iROAS
- Incremental revenue divided by spend.
- Brand lift
- The increase in awareness or intent caused by exposure.
- Marketing mix modelling
- Statistical estimation of each channel's contribution to sales.
Practice problems
Work each problem on paper first, then reveal the answer to check.
What is a cookie window?
Show answer
The period after a click during which a purchase is credited.
300 code orders, 20 % leakage. Orders from the audience?
Show answer
240.
Name the four common UTM parameters.
Show answer
utm_source, utm_medium, utm_campaign, utm_content.
$90 sale, four touches, linear model. Credit each?
Show answer
$22.50.
Under 40-20-40, the first touch on a $200 sale gets?
Show answer
$80.
Test 3.0 %, control 2.4 %, 200,000 in test. Incremental conversions?
Show answer
1,200.
Incremental revenue $90,000, spend $45,000. iROAS?
Show answer
2.0.
p = 0.05, d = 0.01. Rough n per group?
Show answer
16 × 0.0475 ÷ 0.0001 = 7,600.
Why has MMM become popular again?
Show answer
It does not depend on tracking individuals.
Name one Canadian and one US privacy rule relevant to tracking.
Show answer
PIPEDA or Law 25; CCPA/CPRA or other state laws.
Lesson quiz · 5 questions
Score 60% or more to complete this lesson.
Create a free account to save your progress, take quizzes and earn a certificate.