
ITIL-120 · Lesson 12 of 12 · 35 min
Reporting, culture and a capstone case
Principles, governance and improvement models only work if people use them, and people use them when the culture supports it. This final lesson covers three linked topics. First, reporting: how to present measures through scorecards and objectives so they inform decisions, and how measures can backfire when they become targets. Second, culture: what it is, why it matters for service management, and how leaders shape it. Third, a capstone case that brings the whole course together by applying the principles, governance and the continual improvement model to a struggling service desk.
Reporting that informs decisions
Measurement (lesson 11) produces data; reporting turns data into information people can act on. Good reports answer a question that matters to their audience, compare results with targets and trends rather than presenting isolated numbers, and highlight what needs attention. Lesson 5 warned about information overload: a report that nobody reads or acts on is waste.
Two widely used reporting structures are the balanced scorecard and objectives and key results (OKRs).
The balanced scorecard
The balanced scorecard, developed by Robert Kaplan and David Norton in the 1990s, presents measures from four perspectives so that no single view dominates: financial, customer, internal process, and learning and growth. Applied to an IT service organization, it prevents a focus on cost alone or on technical measures alone.
| Perspective | Question it answers | Example IT measures |
|---|---|---|
| Financial | Are we using money well? | Cost per contact; budget variance |
| Customer | How do consumers see us? | Satisfaction score; service level attainment |
| Internal process | Are our practices working? | Change success rate; MTTR; first-contact resolution |
| Learning and growth | Are we building capability? | Training hours; staff engagement; improvement ideas completed |
Worked problem
Scoring a balanced scorecard
A service organization sets one measure per perspective, with weights agreed by its leadership: financial 20 %, customer 35 %, internal process 30 %, learning and growth 15 %. Each measure is scored as a percentage of target achieved: financial 95 %, customer 80 %, internal process 90 %, learning 60 %. What is the weighted overall score, and which perspective needs most attention?
Show solution
- Financial: 0.20 × 95 = 19.0.
- Customer: 0.35 × 80 = 28.0.
- Internal process: 0.30 × 90 = 27.0.
- Learning and growth: 0.15 × 60 = 9.0. Total: 19.0 + 28.0 + 27.0 + 9.0 = 83.0 %.
Answer: The weighted score is 83 %. Learning and growth is furthest from target (60 %), and customer has the largest weighted shortfall (35 × 20 % = 7 points), so both deserve attention.
Objectives and key results
OKRs pair a qualitative objective with two to five measurable key results. They are typically set quarterly, are public within the organization and are often deliberately ambitious, so achieving around 70 % is considered good. OKRs suit improvement work because they connect a clear direction with measurable progress. They differ from KPIs: a KPI tracks ongoing performance, while an OKR describes a change the organization wants to achieve in a period.
Worked problem
Grading an OKR
Objective: make it effortless for staff to get help. Key results for the quarter: (1) raise self-service share from 20 % to 40 %, achieved 32 %; (2) cut average wait for chat from 6 minutes to 2 minutes, achieved 3 minutes; (3) publish 50 new knowledge articles, achieved 45. Grade each key result as the share of the planned change achieved, then average.
Show solution
- KR1: (32 − 20) ÷ (40 − 20) = 12 ÷ 20 = 0.60.
- KR2: (6 − 3) ÷ (6 − 2) = 3 ÷ 4 = 0.75.
- KR3: 45 ÷ 50 = 0.90.
- Average: (0.60 + 0.75 + 0.90) ÷ 3 = 0.75.
Answer: The OKR scores about 0.75, a solid result for an ambitious objective. Self-service adoption is the weakest key result.
When measures become targets
Goodhart's law, named after the economist Charles Goodhart, is often summarized as: when a measure becomes a target, it ceases to be a good measure. People respond to targets, and if a target can be met in ways that do not deliver the underlying value, some people will meet it that way. Service management offers many examples:
- A target for average call handling time leads agents to end calls before problems are solved.
- A target for tickets closed leads to tickets being closed and reopened, or split into several.
- A target for change success rate leads teams to avoid making needed changes, or to classify failures as "partial successes".
- A target for meeting service levels leads to the clock being paused on technicalities.
Defences include pairing measures so that gaming one harms another (handling time with first-contact resolution, for example), measuring outcomes rather than activity, reviewing measures regularly, and above all building a culture where people understand the purpose behind each measure and feel safe reporting honest results.
The cost of poor quality
One way to make the value of improvement visible to governing bodies is to estimate the cost of poor quality (COPQ): the costs that would disappear if every process worked right first time. COPQ includes internal failure costs (rework, repeat incidents), external failure costs (lost customers, penalties, compensation) and some appraisal costs (extra checking needed because processes are unreliable).
Worked problem
Estimating the cost of poor quality
A service desk handles 10,000 incidents a quarter. Of these, 9 % are reopened (each costing 35 minutes of rework at $48 per hour), service level penalties total $18,000, and an extra quality check on all changes, needed because of past failures, costs $9,000. Estimate the quarterly COPQ.
Show solution
- Reopened incidents: 9 % × 10,000 = 900; rework hours 900 × 35 ÷ 60 = 525; cost 525 × $48 = $25,200.
- External failure: penalties of $18,000.
- Appraisal due to unreliability: $9,000.
- Total COPQ: $25,200 + $18,000 + $9,000 = $52,200 a quarter, or about $208,800 a year.
Answer: Poor quality costs about $52,200 a quarter. Presenting this figure helps governing bodies see the value of investing in improvement.
Culture and service management
Organizational culture is the set of values, beliefs and behaviours shared by people in an organization. It shapes how people act when nobody is checking. The same process can succeed in one organization and fail in another because of culture: honest reporting, collaboration and improvement thrive where people trust each other and feel safe, and wither where mistakes are punished.
The sociologist Ron Westrum described three types of organizational culture based on how information flows. Pathological cultures are power-oriented: information is hoarded and messengers are punished. Bureaucratic cultures are rule-oriented: information flows through formal channels and responsibilities are narrow. Generative cultures are performance-oriented: information flows freely, failures lead to inquiry and new ideas are welcomed. DevOps research has found generative cultures are associated with better delivery performance.
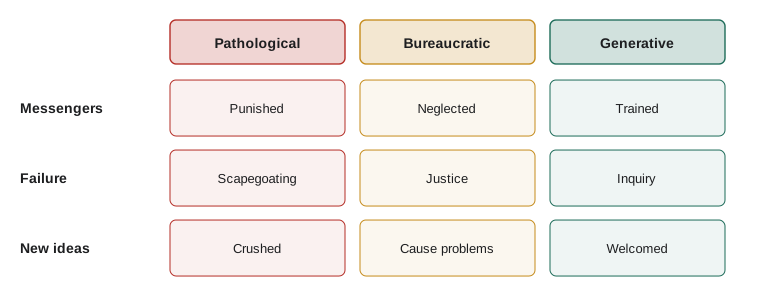
Psychological safety, a shared belief that people can speak up, ask questions and admit mistakes without being punished, is a key feature of generative cultures. It matters for service management because incident reviews, problem analysis and improvement all depend on people being honest about what went wrong. Blameless post-incident reviews, which focus on how the system allowed an error rather than on who made it, are one practical expression. Workload and wellbeing are also part of culture: a service desk under constant pressure is prone to burnout. HSE-109 covers psychological health and safety at work, including stress, burnout and supportive conversations, in depth.
How leaders shape culture
Culture cannot be changed by announcement. It changes as people see what is actually rewarded, tolerated and punished. Leaders shape culture through what they pay attention to, how they react to bad news, what they measure, whom they promote and how they behave themselves. A leader who thanks someone for reporting a mistake does more for visibility than any policy. ITIL's guiding principles describe a culture as much as a method: valuing outcomes, honesty, collaboration and learning.
Agile, Lean and DevOps all emphasize culture. Agile values individuals and interactions and responding to change. Lean emphasizes respect for people and continuous improvement by those doing the work. DevOps emphasizes shared responsibility between development and operations, learning from failure and automation that frees people for valuable work. Service management that draws on these approaches is more likely to succeed when its culture matches its methods.
Capstone: improving a struggling service desk
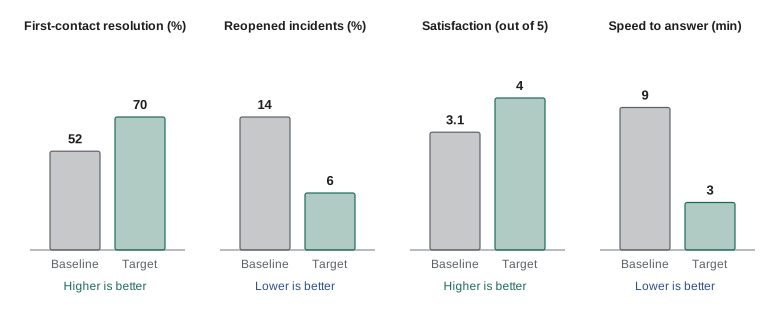
A regional health authority's IT service desk supports 6,000 staff. Complaints are rising, and the governing body has asked the CIO for an improvement plan. The service desk handles 12,000 contacts a month. Measures from the last quarter: first-contact resolution 52 %, average speed to answer 9 minutes, 14 % of incidents reopened, user satisfaction 3.1 out of 5, and staff turnover of 35 % a year. Agents are targeted on average handling time of 6 minutes.
Worked problem
Capstone part 1: vision, current state and target
Apply the first three steps of the continual improvement model to the service desk.
Show solution
- What is the vision? Clinical and administrative staff get IT help quickly and reliably, so that patient care is not disrupted. This links the desk to the organization's purpose (focus on value).
- Where are we now? The baseline is above. The team also observes the desk for two days (start where you are) and finds agents ending calls to meet the 6-minute target, a poorly organized knowledge base and password resets making up 25 % of contacts.
- Where do we want to be? Targets for 12 months: first-contact resolution 70 %, reopened incidents 6 %, satisfaction 4.0, average speed to answer 3 minutes, staff turnover below 20 %.
- The observation reveals Goodhart's law at work: the handling-time target is driving reopened incidents and repeat calls.
Answer: The vision connects the desk to patient care; the baseline is measured and observed; five measurable targets define the gap.
Worked problem
Capstone part 2: plan and expected benefit
Plan the improvement in iterations and estimate the benefit of the first iteration. Each reopened incident costs about 30 minutes of agent time at $45 per hour.
Show solution
- Iteration 1 (months 1–3): replace the handling-time target with paired measures of first-contact resolution and satisfaction (keep it simple; Goodhart defence); introduce self-service password reset (optimize and automate, after simplifying the reset process).
- Iteration 2 (months 4–6): review and restructure the knowledge base with agents (collaborate); introduce swarming for complex incidents.
- Iteration 3 (months 7–12): extend self-service; hold blameless reviews of major incidents; add the desk's measures to the governing body's balanced scorecard (governance: monitor).
- Iteration 1 benefit: if reopens fall from 14 % to 10 % of 12,000 contacts, that is 480 fewer reopens a month; 480 × 0.5 hours × $45 = $10,800 a month.
Answer: Three iterations address measures, automation, knowledge and culture. Iteration 1 alone should save about $10,800 a month in rework, before counting password reset savings.
Worked problem
Capstone part 3: checking and keeping momentum
After 12 months, results are: first-contact resolution 68 %, reopened incidents 6 %, satisfaction 3.9, speed to answer 3.5 minutes, staff turnover 22 %. Assess progress and decide next steps.
Show solution
- Share of gap closed: first-contact resolution (68 − 52) ÷ (70 − 52) = 16 ÷ 18 ≈ 89 %; reopened incidents (14 − 6) ÷ (14 − 6) = 100 %; satisfaction (3.9 − 3.1) ÷ (4.0 − 3.1) = 0.8 ÷ 0.9 ≈ 89 %; speed to answer (9 − 3.5) ÷ (9 − 3) = 5.5 ÷ 6 ≈ 92 %; turnover (35 − 22) ÷ (35 − 20) = 13 ÷ 15 ≈ 87 %.
- Did we get there? Largely: one target met in full, the rest about 87–92 % of the way. The governing body is informed honestly of both success and remaining gaps.
- Keep momentum: embed the new measures, recognize the agents' contribution, record remaining gaps in the continual improvement register and start the next cycle, perhaps focusing on staff wellbeing to reduce turnover further.
Answer: The desk closed about 87–100 % of each gap. The next cycle begins from a much stronger baseline, with the register holding the next set of ideas.
The capstone shows the course's main ideas working together: the principles guided each decision, governance set expectations and monitored results, the continual improvement model structured the work, measures were chosen to avoid Goodhart's law, and culture changed through what leaders rewarded.
Common mistakes
MistakeReporting numbers without targets or trends.
InsteadCompare results with targets and trends and highlight what needs action.
MistakeSetting a single target that can be met without delivering value.
InsteadPair measures so that gaming one harms another, and measure outcomes.
MistakeTreating OKRs as the same as KPIs.
InsteadUse KPIs for ongoing performance and OKRs for changes sought in a period.
MistakeAnnouncing a culture change and expecting it to happen.
InsteadChange what is rewarded, measured and modelled by leaders.
MistakeBlaming individuals after incidents.
InsteadHold blameless reviews that ask how the system allowed the error.
Summary and key terms
- Good reporting answers a question, compares with targets and trends and highlights what needs action.
- The balanced scorecard balances financial, customer, internal process and learning perspectives.
- OKRs pair an objective with measurable key results for a period; KPIs track ongoing performance.
- Goodhart's law: when a measure becomes a target, it ceases to be a good measure.
- The cost of poor quality makes the value of improvement visible to governing bodies.
- Generative cultures and psychological safety support visibility, collaboration and improvement.
- The capstone shows principles, governance, the improvement model, measurement and culture working together.
- Balanced scorecard
- A reporting framework with financial, customer, internal process and learning and growth perspectives.
- OKR
- Objectives and key results: a qualitative objective with measurable key results for a period.
- Goodhart's law
- When a measure becomes a target, it ceases to be a good measure.
- Paired measures
- Two measures chosen so that improving one at the expense of value harms the other.
- Cost of poor quality
- Costs that would disappear if every process worked right first time.
- Organizational culture
- The set of values, beliefs and behaviours shared by people in an organization.
- Generative culture
- A performance-oriented culture where information flows freely and failure leads to inquiry.
- Psychological safety
- A shared belief that people can speak up and admit mistakes without punishment.
- Blameless review
- A post-incident review focused on how the system allowed an error rather than who made it.
- Capstone
- A final exercise that applies the knowledge from a whole course.
Practice problems
Work each problem on paper first, then reveal the answer to check.
Name the four perspectives of the balanced scorecard.
Show answer
Financial, customer, internal process, and learning and growth.
How does an OKR differ from a KPI?
Show answer
An OKR describes a change sought in a period; a KPI tracks ongoing performance.
State Goodhart's law.
Show answer
When a measure becomes a target, it ceases to be a good measure.
Give an example of paired measures.
Show answer
Average handling time with first-contact resolution.
Weights 50 % and 50 %; scores 80 % and 100 %. Weighted score?
Show answer
90 %.
A key result aimed to raise 10 % to 30 % and reached 25 %. Grade?
Show answer
15 ÷ 20 = 0.75.
Name the three types of COPQ in this lesson.
Show answer
Internal failure, external failure and appraisal due to unreliability.
Name Westrum's three cultures.
Show answer
Pathological, bureaucratic and generative.
Why does psychological safety matter in service management?
Show answer
Incident reviews and improvement depend on honest reporting of what went wrong.
Which course covers psychological health and safety at work?
Show answer
HSE-109.
Lesson quiz · 5 questions
Score 60% or more to complete this lesson.
Create a free account to save your progress, take quizzes and earn a certificate.