
PMP-121 · Lesson 7 of 12 · 31 min
Delivering and monitoring communications
A good plan is wasted if the reports nobody reads, the meetings drift and the dashboard is always green until the week before disaster. This lesson covers the delivery side of the plan and manage communication task: writing status reports that drive decisions, designing dashboards, running meetings that produce outcomes, communicating earned value results to non-specialists, using virtual and AI tools responsibly, and monitoring whether communication is actually working.
Status reports that drive decisions
A status report exists to help readers decide and act. Most poor reports fail in one of three ways: they describe activity rather than progress against the plan, they bury the important message under detail, or they hide bad news. A strong report starts with a short summary that says whether the project is on track, what has changed and what decisions are needed from the reader, then supports it with evidence.
| Section | What it should say | Common weakness |
|---|---|---|
| Summary | Overall status, the one or two things that matter most, decisions needed | Missing, or a list of activities |
| Progress against plan | Milestones met or missed, percentage complete against baseline, forecast completion | Activity lists ("held three workshops") |
| Forecast | Expected end date and cost, with confidence and the reasons for change | No forecast, only history |
| Risks and issues | Top items, trend, owner and next action | Long unprioritized lists |
| Changes | Approved and pending changes and their impact | Changes mentioned without impact |
| Decisions and help needed | Specific asks, with dates | Hidden at the bottom or absent |
Worked problem
Rewriting a weak status summary
Original summary: "This period the team held four design workshops, completed 120 test cases and met with the vendor twice. Some data migration issues were encountered. Work continues on the reporting module." Rewrite it for the steering committee.
Show solution
- State the overall status and the main reason: amber, because data migration is behind plan.
- Quantify progress against the baseline: design complete as planned; testing 60 per cent complete against 65 per cent planned.
- Give the forecast: go-live on 3 March is at risk by about two weeks unless migration recovers.
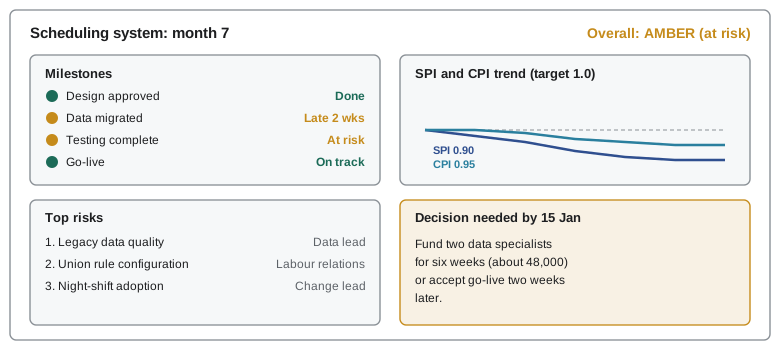
- Name the decision needed: approve two additional data specialists for six weeks at an estimated $48,000, or accept a two-week delay.
Answer: "Status amber. Data migration is two weeks behind because legacy records need more cleansing than expected. Design is complete and testing is broadly on plan. Go-live on 3 March is at risk by two weeks. Decision needed by 15 January: fund two data specialists for six weeks (about $48,000) or accept a 17 March go-live."
Status colours and the watermelon problem
Red, amber and green (RAG) ratings are widely used because they are quick to read. They work only if everyone uses the same definitions. A typical set: green means on track within agreed tolerances; amber means at risk of breaching tolerance, with a recovery plan in hand that the project can deliver itself; red means tolerance is breached or will be without help, and a decision is needed from above. Without definitions, people report green until they are certain of failure, producing so-called watermelon projects: green on the outside, red inside.
Project managers prevent watermelon reporting by defining RAG criteria in the communications plan, tying ratings to measurable thresholds where possible (for example, schedule variance beyond 5 per cent turns amber), rewarding early warnings rather than punishing them and visibly acting on amber ratings. A sponsor who reacts to an amber rating with blame will receive green ratings until the project fails.
Dashboards
A dashboard is a visual summary of status, usually published for pull communication. Good dashboards show a small number of measures that matter to their audience, compare actual results with targets or baselines, show trends rather than single points, and make exceptions stand out. They avoid decoration, three-dimensional charts and colour-only signals. An executive dashboard might show milestone status, cost and schedule performance indices, top risks and benefits forecasts; a team dashboard might show burndown, cycle time and defect trends.
Communicating earned value to non-specialists
Earned value management (covered in depth in CON-310 and in the Process courses of this series) produces precise indices, but stakeholders rarely want indices; they want to know whether the project will finish on time and on budget and what to do about it. The project manager's job is to translate.
Worked problem
Translating earned value into plain language
At month six, planned value (PV) is $400,000, earned value (EV) is $360,000 and actual cost (AC) is $380,000. The budget at completion (BAC) is $1,000,000. Explain the position to the sponsor in plain language.
Show solution
- Schedule performance index: SPI = EV / PV = 360,000 / 400,000 = 0.90. The project has done about 90 per cent of the work planned by now.
- Cost performance index: CPI = EV / AC = 360,000 / 380,000 ≈ 0.947. For every dollar spent, about 95 cents of planned work has been done.
- Estimate at completion using the CPI method: EAC = BAC / CPI ≈ 1,000,000 / 0.947 ≈ $1,056,000.
- Translate: "We are about 10 per cent behind schedule and about 5 per cent over on cost for the work done. If this trend continues, the project will cost roughly $1.06 million, about $56,000 over budget. The main cause is slower data migration. We recommend adding two specialists, which costs more now but should recover the schedule."
Answer: The sponsor hears what the numbers mean for the end date and budget, why it is happening and what is recommended, not just two indices.
Meetings that produce outcomes
Meetings are the main interactive channel and the most expensive one. A productive meeting has a stated purpose, an agenda sent in advance, the right attendees, a facilitator who keeps time and draws out quieter people, and documented outcomes: decisions, actions with owners and dates, and open questions. Minutes need not be long; a short note of decisions and actions, sent within a day, is usually more useful than a transcript.
| Meeting | Purpose | Typical attendees | Key output |
|---|---|---|---|
| Kickoff | Align on objectives, scope, roles and ways of working | Sponsor, key stakeholders, team | Shared understanding and agreed next steps |
| Steering committee | Governance decisions, escalations, gate approvals | Sponsor, executives, project manager | Decisions and direction |
| Status or coordination | Progress, dependencies, issues | Workstream leads | Action list and escalations |
| Stand-up | Daily team synchronization | Team | Visible impediments |
| Sprint review or demo | Inspect results, gather feedback | Team, product owner, stakeholders | Feedback and backlog changes |
| Retrospective | Improve ways of working | Team | Improvement actions |
| Lessons learned | Capture knowledge for future projects | Team, key stakeholders | Recorded lessons |
Virtual tools and AI assistants
Distributed and hybrid projects rely on collaboration platforms, chat, shared documents and video. These tools make communication faster but also noisier: important decisions disappear into chat threads, and people in different time zones miss context. Good practice includes agreeing which channel is used for what (for example, chat for quick questions, the issue tracker for issues, a decision log for decisions), summarizing decisions in a durable place and respecting working hours.
Many organizations now use AI tools to transcribe and summarize meetings, draft reports and translate documents. They can save time, but the project manager remains responsible for accuracy and confidentiality. Summaries can miss nuance or misattribute statements, translations can change meaning, and uploading confidential information to an unapproved tool can breach contracts or privacy law. Use only tools your organization has approved, tell participants when meetings are recorded or transcribed, review AI-generated content before sending it, and never let a summary replace a decision record that the decision makers have confirmed.
In Canada, recording or transcribing a meeting collects personal information, so notice and purpose limits under PIPEDA or provincial privacy law apply, and federal and provincial privacy commissioners have issued guidance on generative AI. Quebec's privacy law also requires organizations to inform people when decisions about them are made exclusively by automated processing.
Monitoring communication effectiveness
Monitoring asks whether communication is reaching the right people and producing the intended understanding and action. Useful indicators include whether decisions are made on time, whether stakeholders are surprised at reviews, the number of repeated questions on the same topic, attendance and participation in key meetings, use of the dashboard or repository, and direct feedback from short surveys or conversations. When monitoring shows a problem, the response might be a change of channel, frequency, format or messenger, recorded as an update to the communications management plan.
Worked problem
Fixing a communication problem found in monitoring
Monitoring shows that unit managers repeatedly ask the same questions about the new roster rules, and attendance at the fortnightly webinar has fallen from 40 to 12. What should change?
Show solution
- Ask a few managers why: the webinars are at a time that clashes with shift handover and repeat general content.
- Replace the webinar with a short written update and a frequently-asked-questions page (pull) maintained by the change lead.
- Hold short in-person drop-in sessions on each unit at a time that suits shift patterns (interactive).
- Track whether repeated questions fall over the next month.
- Update the communications management plan to reflect the change.
Answer: The project changes timing, channel and format based on feedback, then measures whether the change worked.
Communicating in a crisis
Sometimes a project faces a crisis: a serious safety incident, a data breach, a failed launch that affects customers, or intense media attention. Crisis communication follows the plan's event-triggered rules but needs extra discipline. Establish a single source of truth and one authorized spokesperson; tell affected people and regulators quickly and accurately what is known, what is not yet known and when the next update will come; avoid speculation; coordinate legal, communications and executive review without letting it delay essential safety information; and keep a log of what was communicated, to whom and when. After the crisis, review what worked and update the plan.
Worked problem
First communication after a failed launch
A new online booking system for a recreation department fails on launch morning, and thousands of residents cannot register for programs. What should the first communication contain?
Show solution
- Issue a short statement within the hour from the authorized spokesperson.
- Say what happened in plain language: the registration system is unavailable.
- Say what people should do: do not keep retrying; registration will reopen and existing places are held.
- Say what is being done and when the next update will be: technical teams are working on it; next update at noon.
- Publish on the website and social channels, brief front-line staff and the contact centre, and inform elected officials before media enquiries arrive.
Answer: Fast, factual, actionable and coordinated: what happened, what to do, what is being done and when the next update comes, through every channel residents use.
Common mistakes
MistakeReporting activities instead of progress against the plan.
InsteadReport progress against the baseline, a forecast and the decisions needed.
MistakeUsing RAG colours without agreed definitions.
InsteadDefine green, amber and red with thresholds and act on amber early.
MistakeGiving sponsors raw earned value indices without explanation.
InsteadTranslate indices into end-date and cost forecasts, causes and recommendations.
MistakeHolding meetings without recording decisions and actions.
InsteadSend short notes of decisions, actions, owners and dates within a day.
MistakeSending AI-generated meeting summaries without review.
InsteadUse approved tools, inform participants and check summaries before sending.
Summary and key terms
- Status reports should lead with overall status, key changes and decisions needed.
- RAG ratings need agreed definitions and a culture that welcomes early warnings, or projects become watermelons.
- Dashboards show a few relevant measures against targets, with trends and clear exceptions.
- Earned value results should be translated into plain-language forecasts and recommendations.
- Productive meetings have a purpose, agenda, right attendees and documented outcomes.
- Virtual and AI tools need clear channel rules, approved tools, notice and human review.
- Monitor communication by its effects, such as timely decisions and fewer surprises, and update the plan.
- Status report
- A periodic report of progress, forecast, risks, issues, changes and decisions needed.
- RAG status
- A red, amber and green rating of project health against agreed criteria.
- Watermelon project
- A project reported as green while serious problems lie underneath.
- Dashboard
- A visual summary of key project measures, usually published for pull access.
- Schedule performance index (SPI)
- Earned value divided by planned value.
- Cost performance index (CPI)
- Earned value divided by actual cost.
- Estimate at completion (EAC)
- The expected total cost of the project when complete.
- Minutes
- A record of meeting decisions, actions and key points.
- Action item
- A task arising from a meeting, with an owner and a due date.
- Communication effectiveness
- The degree to which communication produces the intended understanding and action.
Practice problems
Work each problem on paper first, then reveal the answer to check.
What should the first section of a status report contain?
Show answer
Overall status, the most important points and any decisions needed.
What is a watermelon project?
Show answer
One that is reported green but is in serious trouble.
PV is $200,000 and EV is $180,000. What is SPI?
Show answer
0.90.
EV is $180,000 and AC is $200,000. What is CPI?
Show answer
0.90.
BAC is $500,000 and CPI is 0.80. What is EAC using the CPI method?
Show answer
$625,000.
Name three things that make a dashboard effective.
Show answer
Few relevant measures, comparison with targets and visible trends or exceptions.
What should meeting notes record?
Show answer
Decisions, actions with owners and dates, and open questions.
Give two risks of AI meeting summaries.
Show answer
Inaccurate or misattributed content and confidentiality breaches.
Give two indicators that communication is not working.
Show answer
Stakeholders surprised at reviews and repeated questions on the same topic.
What should happen to the communications plan after monitoring finds a problem?
Show answer
It should be updated to reflect changes in channel, timing, format or messenger.
Lesson quiz · 5 questions
Score 60% or more to complete this lesson.
Create a free account to save your progress, take quizzes and earn a certificate.