
ROB-420 · Lesson 8 of 12 · 29 min
Validation and verification of automated vehicles
How do you know an automated vehicle is safe enough to carry the public? This is perhaps the hardest question in the field. Automated driving systems combine machine learning, which has no complete specification, with an open world, which has no complete list of situations. Simply driving until nothing bad happens does not work, because serious crashes are rare events. This lesson covers the statistics of demonstrating safety by driving, why simulation and scenario-based testing are essential, how disengagement data should and should not be interpreted, and the main standards: ISO 26262 for functional safety, ISO 21448 for the safety of the intended functionality, and UL 4600 for the safety case of autonomous products. Lesson 12 applies these ideas in a capstone safety case.
Verification versus validation
Verification asks whether the system was built right: does each component meet its specification? Validation asks whether the right system was built: does the vehicle, in its operational design domain, achieve acceptable safety in the real world? Verification uses reviews, unit tests, static analysis, formal methods and hardware-in-the-loop tests against requirements. Validation needs evidence about behaviour in the world, from road testing, simulation, test tracks and field monitoring. Both are needed, and neither is sufficient alone.
The statistics of driving to safety
Suppose a fleet drives \( n \) miles with no fatal crash. How confident can we be that its fatality rate is below some value? If crashes follow a Poisson process with rate \( \lambda \) per mile, the probability of zero crashes in \( n \) miles is \( e^{-\lambda n} \). To claim with 95 % confidence that \( \lambda < \lambda_0 \), we need \( e^{-\lambda_0 n} \leq 0.05 \), that is \( n \geq \ln 20/\lambda_0 \approx 3/\lambda_0 \). This is the rule of three.
A 2016 RAND Corporation study, Driving to Safety, applied this reasoning to the US human fatality rate of about 1.09 per 100 million miles at the time. Showing with 95 % confidence that an automated fleet's fatality rate is no worse than that, with zero fatalities, takes about 275 million miles. Showing that it is meaningfully better, for example 20 % lower, with statistical power, would take billions of miles, around 8.8 billion in RAND's estimate, equivalent to hundreds of years of driving for a fleet of 100 vehicles. The study's conclusion was not that validation is impossible but that road driving alone cannot provide the evidence; it must be combined with simulation, scenario testing and other methods.
# Miles needed to demonstrate safety by the rule of three, and what large fleets achieve
import numpy as np
targets = {"fatal (1.09 per 100M mi)": 1.09e-8,
           "injury crash (about 1 per 1M mi)": 1e-6,
           "police-reported crash (about 2 per 1M mi)": 2e-6}
for name, lam in targets.items():
    n = -np.log(0.05) / lam
    print(f"{name:42s}: {n:14,.0f} failure-free miles")
fleet, miles_per_day = 1000, 200
days = (-np.log(0.05) / 1.09e-8) / (fleet * miles_per_day)
print(f"1000 vehicles at 200 mi/day reach the fatal-rate figure in {days / 365:.1f} years")fatal (1.09 per 100M mi) : 274,837,823 failure-free miles injury crash (about 1 per 1M mi) : 2,995,732 failure-free miles police-reported crash (about 2 per 1M mi) : 1,497,866 failure-free miles 1000 vehicles at 200 mi/day reach the fatal-rate figure in 3.8 years
Worked problem
Rule of three with a deployed fleet
A robotaxi fleet has driven 50 million miles (80 million km) with no crash causing serious injury. What upper bound on its serious-injury crash rate can be claimed with 95 % confidence?
Show solution
- \( \lambda_{95} \approx 3/n = 3/(5 \times 10^7) = 6 \times 10^{-8} \) per mile.
- That is 6 per 100 million miles.
Answer: Below about 6 serious-injury crashes per 100 million miles at 95 % confidence. Whether that is better than human drivers depends on matching the comparison to the same roads, times and conditions.
Comparisons with human drivers are subtle. Automated fleets usually operate in particular cities, speeds and weather, so the human benchmark must be matched to that operational design domain. Crash reporting differs too: automated vehicles record every minor contact, while many human crashes go unreported. Peer-reviewed analyses comparing robotaxi crash rates with matched human benchmarks have appeared in recent years and generally show lower injury crash rates for the automated fleets studied, but each depends on its choices of benchmark and data, and students should read such claims critically.
Disengagements
California requires companies testing with safety drivers to report disengagements, occasions when the system disengaged or the safety driver took over, and miles driven, and these reports are often quoted as a measure of progress. Disengagement rates are a poor safety metric on their own. Companies define disengagements differently, test in very different places, and may deliberately seek hard situations to learn from. A cautious safety driver who takes over often produces more disengagements than a relaxed one. Rates still have value inside one organization, tracked consistently over time, and a confidence interval shows how much they can be trusted.
# Disengagement rate with an exact Poisson confidence interval
import numpy as np
from math import lgamma, exp, log
def pois_cdf(k, mu):
    return sum(exp(i * log(mu) - mu - lgamma(i + 1)) for i in range(k + 1)) if mu > 0 else 1.0
def bound(k, alpha, upper):
    lo, hi = 0.0, 10.0 * (k + 5)
    for _ in range(80):                          # bisection
        mid = 0.5 * (lo + hi)
        if upper:
            ok = pois_cdf(k, mid) > alpha / 2    # push mid higher while cdf is above alpha/2
        else:
            ok = (1 - pois_cdf(k - 1, mid) if k > 0 else 0) < alpha / 2
        lo, hi = (mid, hi) if ok else (lo, mid)
    return 0.5 * (lo + hi)
rng = np.random.default_rng(11)
miles = 120_000
k = rng.poisson(miles / 15_000)                  # true rate: one per 15,000 miles
lo, hi = bound(k, 0.05, False), bound(k, 0.05, True)
print(f"{k} disengagements in {miles:,} miles")
print(f"miles per disengagement: {miles / k:,.0f} (95 % CI {miles / hi:,.0f} to {miles / lo:,.0f})")4 disengagements in 120,000 miles miles per disengagement: 30,000 (95 % CI 11,717 to 110,105)
Simulation and scenario-based testing
Simulation lets developers drive billions of virtual miles and, more importantly, concentrate testing on the dangerous situations that are rare on the road. Several kinds are used. Log replay re-runs recorded drives through new software, with other agents either replayed as recorded or controlled by behaviour models so they react. Synthetic scenario simulation constructs situations from parameters: road layout, agent types, speeds, timing and weather. Sensor simulation renders camera, lidar and radar data so perception can be tested, increasingly using neural rendering to make synthetic data realistic. Hardware-in-the-loop and vehicle-in-the-loop tests run real computers or real vehicles against simulated worlds.
Scenario-based testing organizes this work. Functional scenarios describe a situation in words, such as a pedestrian crossing from behind a parked van; logical scenarios assign ranges to parameters, such as pedestrian speed 0.5 to 3 m/s and van distance 5 to 40 m; and concrete scenarios pick specific values to run. Search methods, including importance sampling and optimization-based falsification, look for the parameter combinations that make the system fail, rather than sampling uniformly. Standards such as ISO 34502 and scenario description formats such as ASAM OpenSCENARIO support this process. Test tracks then confirm the most important scenarios with real hardware, using soft targets that can be safely hit.
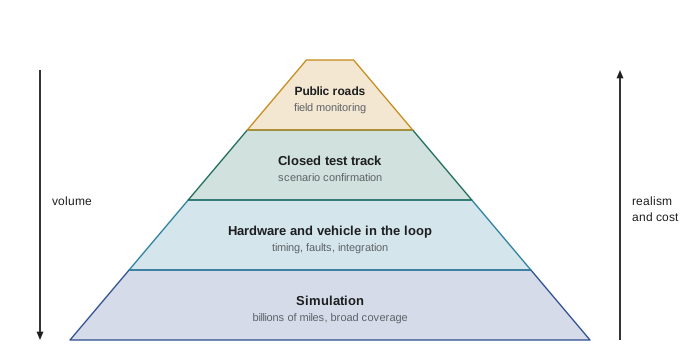
Simulation evidence is only as good as its fidelity. If simulated sensors or simulated drivers behave differently from real ones, the results may mislead. Developers therefore validate the simulator itself, comparing simulated and real outcomes for the same scenarios, and treat the gap between them as a source of uncertainty in the safety argument.
Worked problem
Importance sampling for a rare failure
In uniform random scenario sampling, a dangerous cut-in configuration occurs with probability 1 in 100,000 and the system fails in 2 % of those. How many uniform simulations are needed on average to see 10 failures? If importance sampling generates the dangerous configuration in 10 % of runs, how many then?
Show solution
- Uniform: failure probability per run \( 10^{-5} \times 0.02 = 2 \times 10^{-7} \); for 10 failures, \( 10 / (2 \times 10^{-7}) = 5 \times 10^7 \) runs.
- Importance sampling: \( 0.1 \times 0.02 = 0.002 \) per run; \( 10/0.002 = 5000 \) runs.
- Each failure is weighted by the likelihood ratio \( 10^{-5}/0.1 = 10^{-4} \) to recover the true rate.
Answer: 50 million uniform runs versus 5,000 importance-sampled runs, a 10,000-fold saving, provided the likelihood weights are applied correctly.
Safety standards
ISO 26262, Road vehicles: Functional safety, second edition 2018, addresses hazards caused by malfunctions of electrical and electronic systems: a sensor fails, a processor resets, software has a bug. It defines a safety lifecycle, hazard analysis and risk assessment, and automotive safety integrity levels, ASIL A to D, assigned from the severity, exposure and controllability of each hazard, with D the most demanding. An ASIL determines the rigour of development and the hardware failure metrics that must be met.
ISO 21448, Safety of the intended functionality, or SOTIF, published in 2022, addresses hazards that occur even when nothing is broken: the perception system misclassifies an unusual object, or a planner's logic is insufficient for a situation. It structures the space of scenarios into known safe, known unsafe, unknown unsafe and unknown safe, and asks developers to shrink the unsafe areas, especially the unknown unsafe ones, through analysis, testing and field monitoring. For automated driving, SOTIF issues often dominate.
UL 4600, Standard for Evaluation of Autonomous Products, first published in 2020 and since updated, does not prescribe how to build the system. Instead, it sets requirements for the safety case: a structured argument, supported by evidence, that the system is acceptably safe in its operational design domain. It requires the case to address topics such as machine learning, operational design domain limits, field feedback and lifecycle, and to be independently assessed. Newer documents, such as ISO/PAS 8800 on safety and artificial intelligence in road vehicles, published in 2024, add guidance specific to machine-learning components.
| Standard | Main question | Typical tools |
|---|---|---|
| ISO 26262 (2018) | Could a malfunction cause harm? | HARA, ASIL, FMEA, fault tree analysis, diagnostics |
| ISO 21448 SOTIF (2022) | Could correct behaviour still be unsafe in some scenarios? | Triggering-condition analysis, scenario testing, field monitoring |
| UL 4600 | Is there a credible, complete safety case for the autonomous product? | Structured argument, evidence, independent assessment |
| ISO/PAS 8800 (2024) | Are AI components safe enough? | Data quality, model assurance, monitoring |
Worked problem
Assigning an ASIL
A hazard analysis finds that unintended full braking on a highway could cause a rear-end crash with possible life-threatening injuries (severity S3), occurs in situations encountered frequently (exposure E4), and most drivers behind could not avoid it (controllability C3). What ASIL results?
Show solution
- ISO 26262 combines S, E and C in a table; the highest classes S3, E4 and C3 give the highest level.
- Result: ASIL D.
Answer: ASIL D, the most demanding integrity level, requiring the most rigorous development methods and hardware metrics.
Field monitoring and continuous assurance
Validation does not end at launch. Deployed fleets report incidents, near misses and unusual situations, which feed back into scenario libraries, simulations and software updates. Every update must be re-validated, ideally with regression testing over the full scenario library, before release. Safety performance indicators, measurable proxies such as hard-braking rates, minimum time-to-collision distributions and rule-violation counts, give earlier warning than crash counts. A credible safety case is a living document, updated as evidence accumulates.
Common mistakes
MistakeClaiming safety from a few million miles without crashes.
InsteadRare events need hundreds of millions of miles; use the rule of three to see what the data supports.
MistakeComparing disengagement rates across companies.
InsteadDefinitions, routes and testing goals differ; use them only within one consistent program.
MistakeTrusting simulation results without validating the simulator.
InsteadMeasure and account for the gap between simulated and real behaviour.
MistakeThinking ISO 26262 covers perception limitations.
InsteadFunctional insufficiencies without faults belong to SOTIF, ISO 21448.
MistakeTreating the safety case as finished at launch.
InsteadUpdate it with field data and re-validate every software change.
Summary and key terms
- Verification checks the system meets its specification; validation checks it is safe in the real world.
- The rule of three: about \( 3/\lambda_0 \) failure-free miles are needed to show a rate below \( \lambda_0 \) with 95 % confidence.
- RAND estimated 275 million miles to match, and billions to show improvement over, human fatality rates.
- Disengagement rates are context dependent and weak as cross-company safety metrics.
- Simulation and scenario-based testing, with importance sampling and falsification, focus effort on rare dangerous cases.
- ISO 26262 covers malfunctions, ISO 21448 covers functional insufficiencies, and UL 4600 covers the safety case.
- Field monitoring and safety performance indicators keep the safety case current.
- Verification
- Checking that a system meets its specification.
- Validation
- Checking that the system achieves its intended purpose safely in the real world.
- Rule of three
- With zero events in n trials, the 95 % upper bound on the rate is about 3/n.
- Disengagement
- A transfer of control from the automated system to a safety driver.
- Logical scenario
- A scenario description with parameter ranges.
- Falsification
- Searching for inputs that make a system violate its requirements.
- ASIL
- Automotive safety integrity level, A to D, from ISO 26262.
- SOTIF
- Safety of the intended functionality, ISO 21448.
- Safety case
- A structured argument with evidence that a system is acceptably safe.
- Safety performance indicator
- A measurable metric that gives early evidence about safety.
Practice problems
Work each problem on paper first, then reveal the answer to check.
Zero failures in 1 million miles: 95 % upper bound on rate?
Show answer
About 3 per million miles.
Miles to show a rate below 1 per 10 million with 95 % confidence?
Show answer
About 30 million.
Why are disengagement rates weak cross-company metrics?
Show answer
Definitions, routes and testing goals differ.
What is a logical scenario?
Show answer
A scenario with parameter ranges.
Name two simulation types.
Show answer
Log replay, synthetic scenarios, sensor simulation, hardware in the loop.
What does importance sampling require to stay unbiased?
Show answer
Weighting results by likelihood ratios.
Which standard handles a lidar that misses a black car at night without any fault?
Show answer
ISO 21448 SOTIF.
What three factors set an ASIL?
Show answer
Severity, exposure and controllability.
What does UL 4600 focus on?
Show answer
The safety case for autonomous products.
Give one safety performance indicator.
Show answer
Hard-braking rate, minimum TTC distribution or rule violations.
Lesson quiz · 5 questions
Score 60% or more to complete this lesson.
Create a free account to save your progress, take quizzes and earn a certificate.