
ROB-460 · Lesson 7 of 12 · 30 min
Aerial robots in the field
Drones have become the most widely used field robots. They map farms, mines and construction sites, inspect power lines, bridges, wind turbines and pipelines, count wildlife, monitor forests and wildfires, spray crops and deliver medical supplies to remote communities. ROB-420 lessons 6 and 7 covered quadrotor dynamics, control and onboard autonomy, and ROB-450 lesson 7 covered how aviation regulators authorize drone operations. This lesson takes a field operations view: the physics that limits endurance and payload, how to plan survey and inspection missions, how weather and cold affect flying robots, and how aerial robots work together with ground and marine robots.
Platforms and their trade-offs
Multirotors hover, take off and land vertically and are easy to fly precisely around structures, which makes them the default for inspection and small-area mapping. Their weakness is efficiency: they generate all lift with rotors, so flight times are typically 20 to 45 minutes. Fixed-wing drones use a wing for lift and fly for hours at higher speed, covering large areas for mapping and monitoring, but they need space to launch and land and cannot hover. Hybrid vertical take-off and landing (VTOL) aircraft combine rotors for take-off and landing with a wing for cruise, at the cost of extra weight and complexity. Tethered drones receive power through a cable from the ground and can stay aloft for many hours at a fixed point, useful for communications relay, surveillance of an incident site or persistent observation. Helicopter-type drones with a single main rotor carry heavier payloads and are used for spraying and lidar mapping.
| Platform | Typical endurance | Strengths | Typical field uses |
|---|---|---|---|
| Small multirotor | 20 to 45 min | Hover, precise positioning, simple operation | Inspection, site mapping, search and rescue |
| Heavy-lift multirotor | 10 to 25 min with payload | Large payloads such as spray tanks or lidar | Crop spraying, lidar surveys, delivery |
| Fixed-wing | 1 to 3 h or more | Efficient coverage of large areas | Regional mapping, wildlife and ice surveys |
| Hybrid VTOL | 1 to 2 h | Vertical take-off with wing-borne cruise | Corridor mapping of pipelines and power lines, delivery |
| Tethered multirotor | Many hours | Persistent position, ground power | Communication relay, incident overwatch |
Hover power and endurance
Momentum theory gives a simple estimate of the ideal power needed for a rotor to hover. A rotor of disc area \( A \) producing thrust \( T \) in air of density \( \rho \) needs ideal induced power
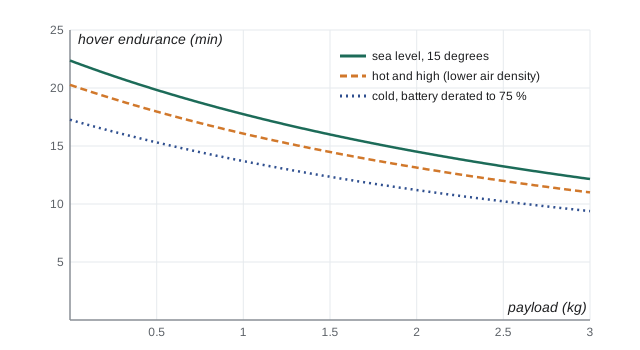
Real rotors are less efficient; dividing by a figure of merit, typically about 0.6 to 0.75 for small drone propellers, and by motor and electronics efficiency gives the electrical power. Two consequences matter in the field. Power rises with thrust to the power 1.5, so adding payload increases power faster than weight, and endurance falls quickly. Power falls with larger rotor area, so larger, slower propellers are more efficient, which is why long-endurance multirotors have large rotors. Air density also matters: at high altitude or in hot weather, density falls and the same thrust needs more power, reducing endurance and payload; in cold air density rises, which helps the rotors, but batteries lose capacity, as lesson 1 showed.
# Hover endurance of a quadrotor versus payload from momentum theory (illustrative values)
import math
rho, g = 1.225, 9.81
rotor_d, n_rotors = 0.38, 4                 # 15-inch propellers
area = n_rotors * math.pi * (rotor_d / 2) ** 2
fm, eta = 0.65, 0.85                         # figure of merit and motor/ESC efficiency
empty_kg, battery_kg, battery_wh = 4.2, 1.6, 355.0
usable = 0.80                                # keep 20 % reserve
avionics_w = 25.0
for payload in (0.0, 0.5, 1.0, 2.0, 3.0):
    m = empty_kg + battery_kg + payload
    T = m * g
    p_elec = T ** 1.5 / math.sqrt(2 * rho * area) / (fm * eta) + avionics_w
    minutes = battery_wh * usable / p_elec * 60
print(f"payload {payload:3.1f} kg mass {m:4.1f} kg hover power {p_elec:6.0f} W endurance {minutes:4.1f} min")payload 0.0 kg mass 5.8 kg hover power 762 W endurance 22.4 min payload 0.5 kg mass 6.3 kg hover power 859 W endurance 19.8 min payload 1.0 kg mass 6.8 kg hover power 960 W endurance 17.7 min payload 2.0 kg mass 7.8 kg hover power 1174 W endurance 14.5 min payload 3.0 kg mass 8.8 kg hover power 1402 W endurance 12.2 min
Adding a 3 kg payload to this 5.8 kg drone raises hover power by more than 80 per cent and cuts hover endurance nearly in half, from about 22 to about 12 minutes. Forward flight at moderate speed usually needs somewhat less power than hover for a multirotor, because the rotor meets more air, but wind, climbing and manoeuvring add load. Mission planners use measured power curves from flight tests rather than these idealized numbers, and keep reserves for headwinds on the return leg.
Planning survey missions
Photogrammetric mapping turns overlapping photographs into orthomosaics, elevation models and 3D point clouds. CON-250 lesson 4 introduced ground sample distance (GSD), the ground size of one image pixel, from the camera's focal length, pixel pitch and flying height. Mission planning then sets forward overlap along a flight line and side overlap between lines; typical values are 70 to 80 per cent forward and 60 to 70 per cent side for general mapping, and higher over vegetation or water, where matching features is harder. The image footprint on the ground and the overlaps determine line spacing and photo interval, and with the flight speed and turn time they determine flight time and the number of battery swaps.
# Survey planning: lines, photos, flight time and battery swaps for a block
import math
area_w, area_l = 600.0, 900.0            # block size in m (lines run along the 900 m side)
gsd = 0.025                              # 2.5 cm per pixel
img_w_px, img_h_px = 5472, 3648          # camera sensor resolution
side, fwd = 0.70, 0.80
speed, turn_s, flight_min = 10.0, 15.0, 25.0  # m/s, s per turn, usable minutes per battery
foot_w, foot_h = gsd * img_w_px, gsd * img_h_px
line_spacing, photo_spacing = foot_w * (1 - side), foot_h * (1 - fwd)
lines = math.ceil(area_w / line_spacing) + 1
photos = lines * (math.ceil(area_l / photo_spacing) + 1)
time_s = lines * area_l / speed + (lines - 1) * turn_s
batteries = math.ceil(time_s / 60 / flight_min)
print(f"footprint {foot_w:.0f} m x {foot_h:.0f} m, line spacing {line_spacing:.1f} m, photo every {photo_spacing:.1f} m")
print(f"lines {lines}, photos {photos}, flight time {time_s/60:.1f} min, batteries {batteries}")
print(f"photo interval at {speed:.0f} m/s: {photo_spacing/speed:.1f} s")footprint 137 m x 91 m, line spacing 41.0 m, photo every 18.2 m lines 16, photos 816, flight time 27.8 min, batteries 2 photo interval at 10 m/s: 1.8 s
The photo interval must be longer than the camera's minimum interval between shots, and the shutter must be fast enough to avoid motion blur: at 10 m/s with a 2.5 cm GSD, an exposure of 1/1,000 s moves the camera 1 cm, less than half a pixel. Ground control points or RTK-equipped drones tie the model to survey coordinates, as CON-250 described. For inspection rather than mapping, missions are planned around the structure: orbits around towers, vertical scans of turbine blades, and corridor flights along lines and pipelines, often with zoom and thermal cameras.
Worked problem
Wind and ground speed on a fixed-wing survey
A fixed-wing drone flies survey lines at an airspeed of 18 m/s. A 7 m/s wind blows along the lines. What is the ground speed upwind and downwind, and how does the average compare with still air for a 2 km line flown both ways?
Show solution
- Downwind ground speed: \( 18 + 7 = 25 \) m/s; upwind: \( 18 - 7 = 11 \) m/s.
- Time for 2 km each way: \( 2000/25 + 2000/11 = 80 + 182 = 262 \) s.
- Still air: \( 2 \times 2000 / 18 = 222 \) s, so wind adds about 18 per cent to the time.
- Downwind the camera interval must keep pace with the higher ground speed to maintain forward overlap.
Answer: Ground speeds of 25 m/s downwind and 11 m/s upwind; a round trip takes about 18 per cent longer than in still air, and wind also limits overlap and image quality.
Weather, cold and icing
Weather sets the envelope for flying robots more tightly than for most ground robots. Manufacturers specify maximum wind speeds, often around 10 to 15 m/s for small multirotors, and gusts near terrain, structures and cliffs are stronger and more turbulent than forecasts suggest. Rain and snow can damage electronics without suitable sealing, and many drones have ingress ratings well below those of ground robots. Cold reduces battery capacity and peak power, which can cause sudden voltage sag and loss of thrust when a drone climbs or fights a gust; operators pre-warm batteries and reduce planned flight times. Icing is a particular hazard in Canadian and northern US winters: supercooled fog or drizzle can form ice on propellers within minutes, cutting thrust and causing vibration, and only specialized drones have ice protection. Wildfire smoke and low visibility may ground operations even when the aircraft could fly, because operators must maintain situational awareness of other aircraft.
| Condition | Effect on drones | Operational response |
|---|---|---|
| Strong or gusty wind | Drift, high power use, loss of control near structures | Respect wind limits, plan upwind return, keep distance from structures |
| Cold | Battery capacity and power loss | Pre-warm and insulate batteries, shorten missions, monitor voltage |
| Icing conditions | Ice on propellers and airframe, loss of thrust | Do not fly in freezing fog or drizzle unless the aircraft is ice-protected |
| Rain and snow | Water ingress, wet lenses | Use rated aircraft or postpone |
| High temperature and altitude | Lower air density, less thrust margin | Reduce payload, check performance charts |
| Low visibility and smoke | Reduced awareness of other aircraft and terrain | Postpone, or operate only under approvals and procedures that address it |
Spraying, delivery and other field missions
Agricultural spraying drones carry tanks of tens of litres and apply pesticides or fertilizers to fields, orchards and terrain that ground sprayers cannot reach, and have been widely adopted in East Asia. In North America their use has grown quickly, but it is constrained by pesticide labelling as well as aviation rules: the product must be approved for aerial application by drone, and the operator must hold the right aviation and pesticide applicator authorizations.
In Canada, Health Canada's Pest Management Regulatory Agency (PMRA) determines whether a pesticide label permits application by remotely piloted aircraft, and provincial agencies license applicators; the aviation side is regulated by Transport Canada under the Canadian Aviation Regulations, as ROB-450 described.
Delivery drones carry medical supplies, samples and small parcels. Some of the most successful services have flown blood, vaccines and laboratory samples over difficult terrain or to remote communities, where road travel is slow; trials in northern and Indigenous communities in Canada have explored drone delivery of medical supplies. Search and rescue teams use drones with thermal cameras to search large areas quickly, and wildfire agencies use them for mapping fire perimeters and finding hot spots at night. Wildlife biologists count seals, whales, caribou and seabird colonies from aerial images, increasingly with machine-learning detectors, and must manage disturbance to animals by choosing flight heights and approach patterns carefully.
Worked problem
Area search with a thermal drone
A search team must cover a 2 km by 1 km area. Their thermal camera reliably detects a person within a swath 60 m wide at the planned height. The drone flies at 8 m/s with 20 s turns and has 30 minutes per battery. How long does a complete search take, and how many batteries are needed?
Show solution
- Lines along the 2 km side: \( 1000 / 60 \approx 16.7 \), so 17 lines.
- Line time: \( 17 \times 2000 / 8 = 4250 \) s; turns: \( 16 \times 20 = 320 \) s; total about 4570 s or 76 min.
- Batteries: \( 76 / 30 \approx 2.5 \), so 3 batteries plus transit time.
Answer: About 76 minutes of flying and three batteries for one complete pass; probability of detection is below 100 per cent, so planners often search high-probability areas first and repeat passes.
Air-ground and air-sea teams
Aerial robots are often most valuable as partners for ground or marine robots. A drone can scout ahead of a ground robot to build a terrain map for route planning, find the edges of a flooded area, or locate weeds for a ground robot to treat. Drones can serve as communication relays for ground robots in valleys or tunnels, extending the network; in the DARPA Subterranean Challenge, teams deployed drones from ground robots to explore vertical shafts and large caverns that ground robots could not reach. At sea, drones launched from ships or uncrewed surface vessels extend survey reach and spot marine mammals before seismic or construction work. These teams raise the coordination problems of lessons 9 and 10: dividing tasks between robots with very different capabilities and endurance, sharing maps and keeping communication links alive.
Long-range autonomous operations, especially beyond visual line of sight, need regulatory approval and a safety case covering detection and avoidance of other aircraft, link loss and contingency landing. ROB-450 lesson 7 summarized the Canadian and US frameworks; in the field, those approvals shape mission design as much as the aircraft's capabilities do.
Common mistakes
MistakePlanning missions from the drone's advertised maximum flight time.
InsteadUse measured power at the actual payload, temperature and wind, and keep a reserve for the return leg.
MistakeAdding payload in proportion to expected endurance loss.
InsteadHover power rises with thrust to the power 1.5, so endurance falls faster than weight rises.
MistakeUsing low overlap over crops or water to save time.
InsteadFeatureless or repetitive surfaces need higher overlap for reliable photogrammetry.
MistakeFlying in freezing fog because the drone is rated for cold.
InsteadCold ratings do not cover icing; ice on propellers can cause loss of thrust within minutes.
MistakeAssuming a pesticide may be sprayed by drone if it may be sprayed from the ground.
InsteadCheck the product label and applicator licensing for drone application, in addition to aviation rules.
Summary and key terms
- Multirotors hover and inspect, fixed-wings cover large areas, hybrids combine both, and tethered drones give persistence.
- Momentum theory shows hover power rising with thrust to the power 1.5, so payload sharply reduces endurance.
- Air density and battery temperature both affect performance; hot, high conditions and cold batteries reduce margins.
- Survey planning uses GSD, forward and side overlap, speed and turns to set lines, photos, flight time and batteries.
- Wind, cold, icing, rain and smoke set the operating envelope for aerial robots.
- Spraying, delivery, search and rescue and wildlife survey are major field missions with their own approvals.
- Drones often add most value as scouts and communication relays for ground and marine robots.
- Hybrid VTOL
- An aircraft that takes off and lands vertically with rotors and cruises on a wing.
- Tethered drone
- A drone powered through a cable from the ground, allowing long endurance at a fixed location.
- Momentum theory
- A simple model relating rotor thrust, disc area and air density to ideal induced power.
- Figure of merit
- The ratio of ideal hover power to actual rotor power, measuring rotor efficiency.
- Ground sample distance
- The size on the ground represented by one image pixel.
- Forward overlap
- The fraction of each image shared with the next image along a flight line.
- Side overlap
- The fraction of image width shared between adjacent flight lines.
- Icing
- Accumulation of ice on aircraft surfaces from supercooled water droplets.
- Corridor mapping
- Surveying a long, narrow area such as a pipeline or power line route.
- Communication relay
- A robot positioned to extend a radio network to other robots out of direct range.
Practice problems
Work each problem on paper first, then reveal the answer to check.
By what factor does ideal hover power rise if thrust increases by 50 per cent?
Show answer
\( 1.5^{1.5} \approx 1.84 \).
Why are larger propellers more efficient for hovering?
Show answer
Ideal power is inversely proportional to the square root of rotor disc area, so larger area needs less power for the same thrust.
How does hot weather at high altitude affect a drone?
Show answer
Lower air density requires more power for the same thrust, reducing endurance and payload margin.
An image footprint is 120 m wide with 65 per cent side overlap. What is the line spacing?
Show answer
\( 120 \times 0.35 = 42 \) m.
Why do surveys over crops use higher overlap?
Show answer
Crops look similar and move in the wind, making feature matching harder.
A fixed-wing drone with airspeed 20 m/s flies into a 6 m/s headwind. What is its ground speed?
Show answer
14 m/s.
Why is icing more dangerous than cold alone?
Show answer
Ice on propellers rapidly reduces thrust and causes vibration, while cold mainly reduces battery performance gradually.
What approvals are needed to spray pesticide from a drone?
Show answer
A pesticide label permitting drone application, applicator licensing, and aviation authorization for the operation.
Give two ways a drone can help a ground robot.
Show answer
Scouting terrain to build maps for route planning; acting as a communication relay; locating targets for the ground robot.
A 1.5 km by 1 km area is searched with a 50 m swath at 10 m/s with 15 s turns. Estimate flight time.
Show answer
20 lines along 1.5 km: \( 20 \times 150 = 3000 \) s plus \( 19 \times 15 = 285 \) s, about 55 min.
Lesson quiz · 5 questions
Score 60% or more to complete this lesson.
Create a free account to save your progress, take quizzes and earn a certificate.