
SLS-254 · Lesson 11 of 12 · 27 min
Measuring online sales
▶ Video coming soon A video version of this lesson is on the way.
On Monday, November 9, 2026, at Bev's weekly "numbers morning" described in SLS-253, Tessa presented the website's October results for the first time alongside the store's. Bev had one question: "Is the website making us money?" It sounded simple. Tessa's answer took the rest of the meeting, and she repeated it for Aiden in a shorter form at their Wednesday session. "There are three questions hidden in that one," she said. "How much does the website sell? How much does it cost to make those sales? And how much does it help the store sell? We can answer the first precisely, the second fairly well and the third only roughly. All three matter."
This lesson covers the measures retailers use to judge online selling: the core website measures, traffic sources, advertising measures such as return on ad spend, contribution after fulfilment and marketing costs, the problem of attribution, and ways to estimate online influence on store sales. It builds on the funnel from lesson 2 and the retail math from SLS-253.
The core website measures
Most online retail reporting starts with four connected numbers. Sessions are visits to the site. Conversion rate is orders divided by sessions. Average order value (AOV) is revenue divided by orders. And revenue is sessions times conversion rate times AOV. This simple identity is useful because it shows the only three ways to grow online revenue: more visits, a higher share of visits that buy, or bigger orders.
A fifth measure combines them: revenue per session, revenue divided by sessions, which tells how much each visit is worth on average. It is useful for comparing traffic sources and for deciding how much a visit is worth paying for.
| Measure | September | October |
|---|---|---|
| Sessions | 41,000 | 42,600 |
| Orders | 225 | 225 |
| Conversion rate | about 0.55 in 100 | about 0.53 in 100 |
| Revenue | 144,000 dollars | 144,000 dollars |
| Average order value | 640 dollars | 640 dollars |
| Revenue per session | about 3.51 dollars | about 3.38 dollars |
Worked problem
Which lever would add the most?
In October the website had 42,600 sessions, a conversion rate of about 0.53 in 100 (225 orders) and an AOV of 640 dollars. Compare the revenue gained from each of three changes made one at a time: 10 in 100 more sessions; a conversion rate raised to 0.60 in 100; or an AOV raised by 10 in 100.
Show solution
- Current revenue:
- \[225 \times 640 = 144{,}000\]
- Ten in 100 more sessions, same conversion and AOV:
- \[144{,}000 \times 1.10 = 158{,}400\]
- Conversion raised to 0.60 in 100:
- \[42{,}600 \times 0.0060 \times 640 = 255.6 \times 640 \approx 163{,}584\]
- AOV raised by 10 in 100:
- \[225 \times 704 = 158{,}400\]
Answer: More sessions or a higher AOV would each add about 14,400 dollars a month; raising conversion to 0.60 in 100 would add about 19,600 dollars. Conversion improvements, such as the checkout changes in lesson 2, are often the cheapest lever, because the visitors are already there. More sessions usually cost advertising money.
Where visits come from
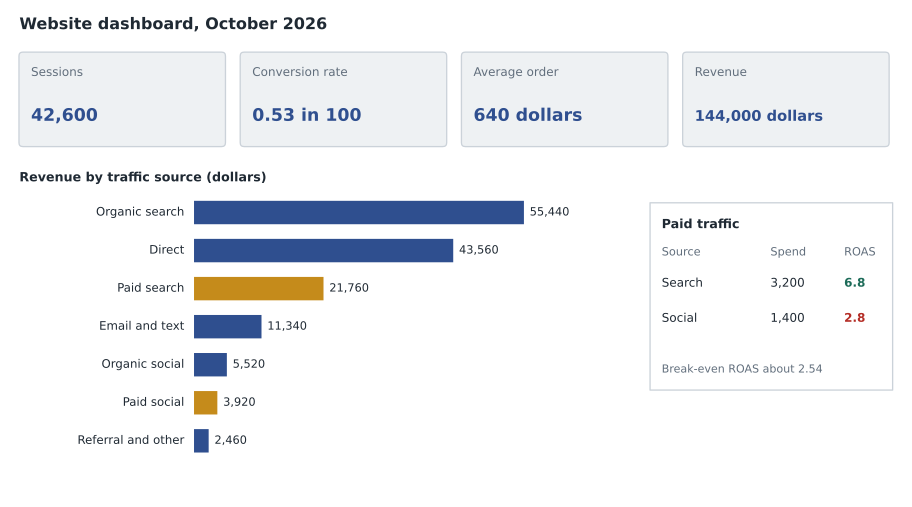
Analytics tools sort sessions by traffic source: how the visitor arrived. Common sources are organic search (unpaid search results), paid search (search ads), direct (typing the address or using a bookmark), social (organic posts), paid social (social media ads), email and text, and referral (links from other websites). Each source brings visitors with different intentions. Someone who types "Juniper and Pine Halden sofa" into a search engine is close to buying; someone who taps a social ad while scrolling is just starting to look.
| Source | Sessions | Orders | Conversion rate | Revenue |
|---|---|---|---|---|
| Organic search | 15,800 | 84 | about 0.53 in 100 | 55,440 dollars |
| Direct | 9,700 | 66 | about 0.68 in 100 | 43,560 dollars |
| Paid search | 6,900 | 34 | about 0.49 in 100 | 21,760 dollars |
| Email and text | 2,300 | 21 | about 0.91 in 100 | 11,340 dollars |
| Organic social | 3,600 | 10 | about 0.28 in 100 | 5,520 dollars |
| Paid social | 3,100 | 7 | about 0.23 in 100 | 3,920 dollars |
| Referral and other | 1,200 | 3 | about 0.25 in 100 | 2,460 dollars |
| Total | 42,600 | 225 | about 0.53 in 100 | 144,000 dollars |
Advertising measures
Paid traffic is bought, so it needs its own measures. Cost per click is ad spend divided by clicks. Customer acquisition cost (CAC) is marketing spend divided by the number of new customers it brings. And the most common measure of online advertising is return on ad spend (ROAS), revenue attributed to the ads divided by the ad spend.
ROAS is easy to misread. A ROAS of 2.8 means every dollar of ads brought 2.80 dollars of revenue, which sounds profitable. But revenue is not profit. If the products sold carry a gross margin of 39.4 in 100, the store's average in 2025 according to SLS-253, then 2.80 dollars of revenue brings only about 1.10 dollars of gross margin, barely more than the dollar spent, and that is before delivery, packing and payment costs. The useful comparison is with break-even ROAS, the ROAS at which the gross margin from the sales just covers the ad spend.
Worked problem
Are the ads paying for themselves?
In October, paid search cost 3,200 dollars and was credited with 21,760 dollars of revenue; paid social cost 1,400 dollars and was credited with 3,920 dollars. Compute each ROAS and compare it with the break-even ROAS at the store's 39.4 in 100 gross margin, and at décor's 56 in 100.
Show solution
- Paid search ROAS:
- \[21{,}760 \div 3{,}200 = 6.8\]
- Paid social ROAS:
- \[3{,}920 \div 1{,}400 = 2.8\]
- Break-even ROAS at 39.4 in 100 margin:
- \[1 \div 0.394 \approx 2.54\]
- Break-even ROAS at 56 in 100 margin:
- \[1 \div 0.56 \approx 1.79\]
Answer: Paid search, at 6.8, is well above break-even. Paid social, at 2.8, barely clears the store-wide break-even of about 2.54 and would lose money once delivery and payment costs are counted, unless it sold mostly high-margin décor. Before cutting it, though, Tessa checked how its sales were being credited, because social ads often influence sales that get credited to other sources.
Contribution: the full cost of an online order
To answer Bev's question properly, Tessa built a contribution view of the average online order: revenue minus the cost of the goods and every variable cost of selling and fulfilling it online. Like the marketplace comparison in lesson 4, it shows how much each order really adds to the business before fixed costs.
Worked problem
Contribution per online order
October's average online order was 640 dollars with a 39.4 in 100 gross margin. Average fulfilment cost was 38 dollars per order (a mix of free pick-up, parcels and the delivery charge customers did not fully cover), payment fees were about 2.9 in 100 of revenue plus 0.30 dollars, returns cost about 9 dollars per order on average, and marketing spend was 4,600 dollars across 225 orders. What was the contribution per order?
Show solution
- Gross margin per order:
- \[640 \times 0.394 = 252.16\]
- Payment fee:
- \[640 \times 0.029 + 0.30 = 18.56 + 0.30 = 18.86\]
- Marketing per order:
- \[4{,}600 \div 225 \approx 20.44\]
- Contribution per order:
- \[252.16 - 38 - 18.86 - 9 - 20.44 = 165.86\]
Answer: Each online order contributed about 166 dollars, or about 26 in 100 of its value, toward fixed costs and profit. Across 225 orders that is about 37,300 dollars a month. The website was making money, though less per dollar of sales than the gross margin alone suggests. The website team's own salaries and software are fixed costs that come out of that contribution.
The attribution problem
Most purchases involve several touches. A customer may see a social ad on Monday, search for the store on Wednesday, read an email on Friday and buy by typing the address on Saturday. Which channel gets credit? Attribution is the method of dividing credit among the touches. Last-click attribution, the default in many tools for years, gives all the credit to the final touch, which favours direct and search traffic and undervalues the ads and posts that first introduced the product. First-click attribution does the reverse. Linear models split credit equally; data-driven models, offered by major analytics and ad platforms, use statistical estimates of each touch's contribution, but how they work is not fully visible to the retailer.
Each model gives a different answer, and none is "true". Ad platforms also tend to credit themselves generously. The most reliable way to learn whether an ad works is a holdout test: run the ads in some areas or to some customers and not others, chosen at random or by matched regions, and compare sales in the two groups. Tessa planned such a test for paid social in early 2027, running ads in some postal code areas around the city and not in comparable others.
Worked problem
Different models, different credit
A customer's path before a 900-dollar order was: paid social ad, organic search, email, direct visit and order. How much revenue does paid social get under last-click, first-click and linear attribution?
Show solution
- Last-click: all credit to the direct visit, so paid social gets
- \[0\]
- First-click: all credit to the paid social ad, so it gets
- \[900\]
- Linear: credit split equally among four touches, so each gets
- \[900 \div 4 = 225\]
Answer: Paid social is credited with nothing, 900 dollars or 225 dollars depending on the model. This is why paid social's ROAS of 2.8 under last-click attribution may understate its effect, and why a holdout test is the better guide to its real value.
Measuring online influence on the store
The third part of Bev's question, how much the website helps the store, cannot be read from website analytics. Lesson 1's counter survey estimated that 63 in 100 store customers looked at the website first. Other methods include asking store customers to scan a code or give an email address at the counter that can be matched to website visits, with consent; counting store visits booked through the website; tracking reservations and video appointments that end in store sales; and watching what happens to store sales in weeks when the website changes. None is exact, but together they show the website's value is much larger than its own sales.
Planning for Black Friday
Measures are also for planning. For Black Friday, November 27, 2026, Tessa used last year's results and October's rates to plan the website's week. She expected sessions to rise to about two and a half times a normal week, conversion to rise because many visitors would be ready to buy at sale prices, and AOV to fall because more orders would be for small, discounted items. The plan, set out on November 11, was a forecast, not a result.
Worked problem
Forecasting Black Friday week
A normal October week had about 9,800 sessions. Tessa plans for 2.5 times as many sessions in Black Friday week, a conversion rate of 0.80 in 100 and an AOV of 520 dollars. What revenue does the plan forecast, and how many orders must the stockroom be ready to pick?
Show solution
- Planned sessions:
- \[9{,}800 \times 2.5 = 24{,}500\]
- Planned orders:
- \[24{,}500 \times 0.0080 = 196\]
- Planned revenue:
- \[196 \times 520 = 101{,}920\]
Answer: The plan forecasts about 196 orders and 101,920 dollars of web revenue in the week, about 70 in 100 of a normal month's web revenue in seven days. Marcus used the order forecast to plan picking and pick-up staff, and Tessa set a check of actual results against the plan for November 30.
Reading the numbers honestly
Website numbers can tell a misleading story if they are read carelessly. A rise in sessions may come from a single viral post that brought visitors who were never going to buy. A higher conversion rate can come from fewer, more serious visitors rather than a better website. And one month is a short period for a store whose sales swing with the seasons. Tessa follows three habits when she reports: compare each month with the same month last year as well as the previous month, show counts alongside rates so that a rate built on a handful of orders is visible, and state what changed during the month, such as a sale or a delivery delay, that could explain the result.
Common mistakes
MistakeJudge the website by its revenue alone.
InsteadLook at contribution after fulfilment, payment, returns and marketing costs, and at its influence on store sales.
MistakeA ROAS above 1 means the ads are profitable.
InsteadCompare ROAS with break-even ROAS, one divided by the gross margin rate, and remember other variable costs.
MistakeLast-click attribution shows which ads work.
InsteadIt undervalues the touches that start a purchase; use holdout tests to measure real effects.
MistakeTrust the ad platform's own figures.
InsteadPlatforms tend to credit themselves generously; check against your own sales data and tests.
MistakeMore traffic is always the answer.
InsteadHigher conversion or larger orders can add as much revenue, often at lower cost.
Summary and key terms
- Online revenue equals sessions times conversion rate times average order value, which shows the three levers for growth.
- Traffic sources bring visitors with different intentions and conversion rates; revenue per session compares them.
- ROAS divides attributed revenue by ad spend and must be compared with break-even ROAS, one divided by the gross margin rate.
- Contribution per order subtracts fulfilment, payment, returns and marketing costs from gross margin, giving a truer view of online profit.
- Attribution models divide credit among touches in different ways; holdout tests are the best guide to whether ads work.
- The website's influence on store sales must be estimated with surveys, matching and appointment tracking, and is often larger than its own sales.
- Average order value
- Revenue divided by the number of orders.
- Revenue per session
- Revenue divided by sessions; what an average visit is worth.
- Traffic source
- How a visitor arrived at the website, such as search, direct, social or email.
- Return on ad spend
- Revenue attributed to advertising divided by the ad spend.
- Break-even ROAS
- The ROAS at which gross margin from ad-driven sales just covers the ad spend.
- Attribution
- The method of dividing credit for a sale among the touches that led to it.
Practice problems
Work each problem on paper first, then reveal the answer to check.
A site has 30,000 sessions, a 0.6 in 100 conversion rate and an AOV of 500 dollars. What is its revenue?
Show answer
30,000 times 0.006 is 180 orders; 180 times 500 is 90,000 dollars.
An ad campaign costs 2,000 dollars and is credited with 9,000 dollars of revenue. What is its ROAS?
Show answer
9,000 divided by 2,000 is 4.5.
What is the break-even ROAS for products with a 40 in 100 gross margin?
Show answer
1 divided by 0.40 is 2.5.
Why is a holdout test a better guide than last-click attribution?
Show answer
It compares sales with and without the ads in comparable groups, instead of assigning credit by a rule.
Lesson quiz · 5 questions
Score 60% or more to complete this lesson.
Create a free account to save your progress, take quizzes and earn a certificate.