
CON-320 · Lesson 12 of 12 · 28 min
Financial analysis, planning and capstone: a financial health review
The previous lessons built Kestrel Builders' financial picture piece by piece: its statements, revenue recognition, WIP schedule, overhead, equipment, cash, financing, taxes and bonding. This final lesson brings the pieces together. It introduces the ratios and benchmarks used to analyze a contractor, shows how to read trends rather than single numbers, sets out a simple framework for an annual financial plan, and then works through a complete financial health review of Kestrel at the end of 2025, of the kind a controller would present to the owners, or a surety analyst would prepare for the file.
Ratio analysis for contractors
Ratios turn the statements into comparable measures. For contractors they fall into five groups: liquidity, leverage, profitability, efficiency and backlog. Each ratio answers a specific question; none is meaningful alone.
| Group | Ratio | Formula | Kestrel 2025 |
|---|---|---|---|
| Liquidity | Current ratio | Current assets ÷ current liabilities | 1.21 |
| Liquidity | Working capital to revenue | Working capital ÷ revenue | 4.2 % |
| Leverage | Debt to equity | Total liabilities ÷ equity | 2.90 |
| Leverage | Revenue to equity | Revenue ÷ equity | 13.3 |
| Profitability | Gross margin | Gross profit ÷ revenue | 8.5 % |
| Profitability | Overhead ratio | G&A expense ÷ revenue | 5.7 % |
| Profitability | Return on equity | Net income ÷ average equity | 31 % |
| Efficiency | Days of receivables | Receivables excluding holdback ÷ daily revenue | 43 |
| Efficiency | Days of payables | Payables excluding holdback ÷ daily contract cost | 40 |
| Backlog | Backlog to working capital | Backlog ÷ working capital | 16.7 |
| Backlog | Months of backlog | Backlog ÷ monthly revenue | 8.4 |
| WIP quality | Underbillings to equity | Contract assets ÷ equity | 26 % |
bs = dict(ca=13_950_000, cl=11_500_000, tl=12_750_000, eq=4_400_000, eq_open=3_520_000,
          ta=17_150_000, ar=6_900_000, ap=5_800_000, under=1_150_000, over=2_250_000, cash=2_850_000)
inc = dict(rev=58_400_000, cost=53_440_000, ga=3_300_000, ni=1_230_000)
backlog = 41_000_000
wc = bs["ca"] - bs["cl"]
r = {
    "current ratio": bs["ca"] / bs["cl"],
    "working capital / revenue": wc / inc["rev"],
    "debt to equity": bs["tl"] / bs["eq"],
    "revenue to equity": inc["rev"] / bs["eq"],
    "gross margin": (inc["rev"] - inc["cost"]) / inc["rev"],
    "overhead ratio": inc["ga"] / inc["rev"],
    "return on equity": inc["ni"] / ((bs["eq"] + bs["eq_open"]) / 2),
    "days of receivables": bs["ar"] / (inc["rev"] / 365),
    "days of payables": bs["ap"] / (inc["cost"] / 365),
    "backlog / working capital": backlog / wc,
    "months of backlog": backlog / (inc["rev"] / 12),
    "underbillings / equity": bs["under"] / bs["eq"],
}
for k, v in r.items():
    pct = k in ("working capital / revenue", "gross margin", "overhead ratio",
                "return on equity", "underbillings / equity")
print(f"{k:28} {v:8.1%}" if pct else f"{k:28} {v:8.2f}")current ratio 1.21 working capital / revenue 4.2% debt to equity 2.90 revenue to equity 13.27 gross margin 8.5% overhead ratio 5.7% return on equity 31.1% days of receivables 43.12 days of payables 39.61 backlog / working capital 16.73 months of backlog 8.42 underbillings / equity 26.1%
Benchmarks and their limits
Contractors compare their ratios with industry benchmarks such as the Construction Financial Management Association's annual benchmarking survey, surety and bank surveys, and IRS and Census data by industry. Benchmarks are useful for spotting outliers, but they need care. They mix firms of different size, trade and accounting policy; they are usually medians, so half of healthy firms fall on each side; and a general contractor and a mechanical contractor should not be compared with the same yardstick. The trend in a firm's own ratios over three to five years is usually more informative than a single comparison with an industry median.
| Kestrel trend (illustrative) | 2022 | 2023 | 2024 | 2025 |
|---|---|---|---|---|
| Revenue ($ millions) | 38.6 | 44.1 | 50.2 | 58.4 |
| Gross margin | 9.4 % | 9.1 % | 8.8 % | 8.5 % |
| Overhead ratio | 6.1 % | 5.9 % | 5.8 % | 5.7 % |
| Working capital ($ millions) | 1.95 | 2.10 | 2.25 | 2.45 |
| Working capital to revenue | 5.1 % | 4.8 % | 4.5 % | 4.2 % |
| Equity ($ millions) | 2.70 | 3.02 | 3.52 | 4.40 |
| Revenue to equity | 14.3 | 14.6 | 14.3 | 13.3 |
| Final GP on completed jobs vs prior-year estimate | −2 % | −4 % | −5 % | −6 % |
The trend tells a clearer story than any single year. Kestrel has grown about 15 % a year and has kept its equity growing roughly in step. But gross margin has slipped every year, working capital has not kept pace with revenue, and completed jobs have finished progressively further below their earlier estimates. These are the early signs of growth beyond capacity described in Lesson 1, even though every year has been profitable.
A screening score
Researchers have built scores that combine ratios to predict financial distress. The best known is Edward Altman's Z-score, first published in 1968, and its later variants. A version designed for non-manufacturing private firms, often called Z″, weights four ratios. It is a screening tool only: it was not built for contractors, it uses book values that depend on revenue recognition estimates, and it should prompt questions, not conclusions.
Here X₁ is working capital divided by total assets, X₂ retained earnings divided by total assets, X₃ earnings before interest and taxes divided by total assets, and X₄ book equity divided by total liabilities. Commonly cited zones are above about 2.6 as relatively safe, between about 1.1 and 2.6 as a gray zone, and below about 1.1 as a distress zone.
ta, wc, re, ebit, eq, tl = 17_150_000, 2_450_000, 4_200_000, 1_700_000, 4_400_000, 12_750_000
x = [wc / ta, re / ta, ebit / ta, eq / tl]
w = [6.56, 3.26, 6.72, 1.05]
z = sum(a * b for a, b in zip(w, x))
print("Ratios:", ", ".join(f"{v:.3f}" for v in x))
print(f"Z'' score: {z:.2f}")
# The same firm after a 1.5 million loss on one job
loss = 1_500_000
x2 = [(wc - loss) / (ta - loss), (re - loss) / (ta - loss), (ebit - loss) / (ta - loss),
      (eq - loss) / tl]
print(f"Z'' after a 1.5M job loss: {sum(a * b for a, b in zip(w, x2)):.2f}")Ratios: 0.143, 0.245, 0.099, 0.345 Z'' score: 2.76 Z'' after a 1.5M job loss: 1.29
Kestrel scores about 2.76, just inside the safer range. A single loss of $1.5 million, about the size of the gross profit on its largest job, would drop it into the gray zone. That sensitivity, rather than the score itself, is the useful insight: a contractor's financial health can change quickly because its equity is small relative to its volume.
The annual financial plan
Most well-run contractors prepare an annual plan that turns the business strategy into numbers: expected revenue from backlog and new work, gross margin by type of work, overhead budget, equipment spending, cash flow, financing and the resulting balance sheet and ratios. The plan becomes the benchmark for monthly results and the basis for discussions with the surety and bank.
| Plan element | Source | Kestrel 2026 plan (illustrative) |
|---|---|---|
| Revenue from existing backlog | WIP schedule: revenue to be earned and schedules | $33.5 million of the $41.0 million backlog |
| Revenue from new work | Pipeline, hit rates, start dates | $30.5 million, requiring about $48 million of new awards |
| Gross margin | Backlog at current estimates; new work at target bid margins | 8.4 % blended |
| Overhead | Department budgets, new hires | $3.55 million (5.5 %), including two project managers and an estimator |
| Equipment | Replacement plan and new needs | $700,000 purchases, financed 80 % |
| Owner distributions | Policy agreed with surety and bank | $250,000 |
| Working capital target | Surety and bank expectations | At least $3.0 million at year-end |
| Cash and borrowing | 12-month cash forecast | Line of credit peaks near $1.5 million in late summer |
rev = 64_000_000
gm, overhead, interest, tax_rate = 0.084, 3_550_000, 150_000, 0.215
for name, r, g in (("Plan", rev, gm), ("Downside", 52_000_000, 0.072), ("Upside", 68_000_000, 0.088)):
    op = r * g - overhead
    ni = (op - interest) * (1 - tax_rate)
    wc_end = 2_450_000 + ni - 250_000 - 0.2 * 700_000      # retained profit less unfinanced equipment
    print(f"{name:8}: revenue {r / 1e6:4.0f}M, operating income {op:>10,.0f}, "
f"net income {ni:>10,.0f}, year-end working capital {wc_end:>10,.0f}")Plan : revenue 64M, operating income 1,826,000, net income 1,315,660, year-end working capital 3,375,660 Downside: revenue 52M, operating income 194,000, net income 34,540, year-end working capital 2,094,540 Upside : revenue 68M, operating income 2,434,000, net income 1,792,940, year-end working capital 3,852,940
The plan meets the $3.0 million working capital target with a little room. The downside case, with revenue of $52 million at a 7.2 % margin, leaves operating income near zero and working capital slightly lower than today; Kestrel would still be solvent, but its surety would see three years of improvement undone. Scenario analysis like this helps management decide in advance what it would cut, and when, if the downside starts to appear.
Backlog and overhead coverage
One of the most revealing planning measures is how much gross profit is locked into the backlog compared with next year's overhead. If the backlog's remaining gross profit covers most of the overhead, the firm can be selective about new work; if it covers little, the firm is under pressure to win work quickly, which is when contractors bid too low.
contracts = [14_600_000, 3_850_000, 21_400_000, 6_900_000, 9_200_000, 7_750_000, 4_300_000]
est_cost  = [13_250_000, 3_520_000, 19_800_000, 6_780_000, 8_330_000, 7_900_000, 3_850_000]
cost_td   = [9_940_000, 2_710_000, 7_120_000, 5_650_000, 1_240_000, 2_860_000, 620_000]
rev_td = [c * t / e for c, e, t in zip(contracts, est_cost, cost_td)]
remaining_rev = sum(contracts) - sum(rev_td)
remaining_gp = sum(max(c - e, 0) for c, e in zip(contracts, est_cost)) - sum(
    max(r - t, 0) for r, t, c, e in zip(rev_td, cost_td, contracts, est_cost) if c > e)
signed_not_started, its_margin = 5_230_000, 0.08
backlog = remaining_rev + signed_not_started
gp_in_backlog = remaining_gp + signed_not_started * its_margin
print(f"Revenue to be earned on open jobs: {remaining_rev:,.0f}")
print(f"Total backlog: {backlog:,.0f}")
print(f"Gross profit remaining in backlog: {gp_in_backlog:,.0f}")
print(f"Months of 2026 overhead covered: {gp_in_backlog / (3_550_000 / 12):.1f}")Revenue to be earned on open jobs: 35,770,158 Total backlog: 41,000,158 Gross profit remaining in backlog: 2,994,254 Months of 2026 overhead covered: 10.1
Kestrel's backlog carries about $3.0 million of remaining gross profit, enough to cover about ten months of next year's overhead. That is a reasonably comfortable position, provided the estimates hold; given the history of fade, management should assume some of that gross profit will not materialize.
Capstone: Kestrel's financial health review
The review below is the kind of report a controller would prepare for the owners and share, in summary, with the surety and bank. It uses only figures developed in this course. Students should be able to reproduce every number.
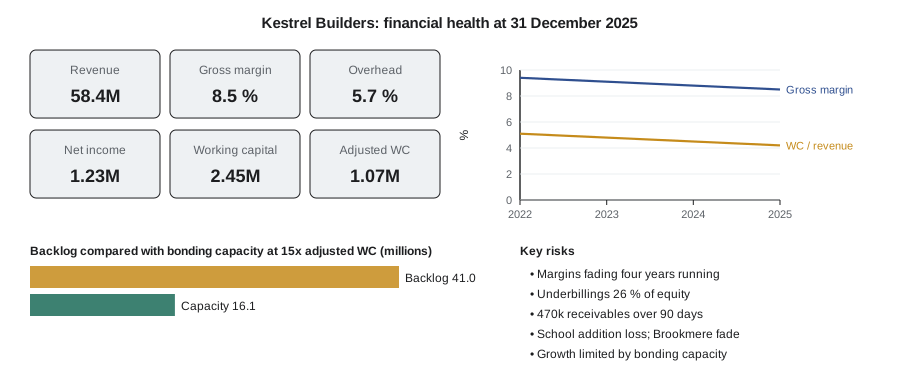
| Area | Finding | Assessment |
|---|---|---|
| Profitability | Revenue $58.4M, gross margin 8.5 %, overhead 5.7 %, net income $1.23M, ROE 31 % | Profitable, but gross margin has declined four years in a row |
| Liquidity | Working capital $2.45M, current ratio 1.21, cash $2.85M against overbillings $2.25M | Adequate but thin; overbillings barely covered by cash |
| Leverage | Liabilities 2.9 times equity, revenue 13.3 times equity | Typical for a GC, but little room for a large loss |
| WIP quality | Underbillings $1.15M (26 % of equity); profit fade of $535,000 this quarter; loss on school addition; completed jobs finished 6 % below estimates | Main concern: estimates appear optimistic |
| Receivables | $470,000 over 90 days, mostly from one developer | Collection risk; legal rights should be pursued |
| Cash conversion | Cycle about zero days | Depends on subcontractor terms and overbillings |
| Bonding | Adjusted working capital about $1.07M; backlog about 38 times that | Bonding capacity is the binding constraint on growth |
| Equipment | Equipment cost center under-recovered by $140,000 | Fleet underused or rates too low |
| Tax and trust | Tax method appropriate; payroll taxes current | No issues noted |
| Screening score | Z'' about 2.76 | Just inside safer range; sensitive to a single large loss |
Recommendations
| Recommendation | Lesson | Expected effect |
|---|---|---|
| Require project managers to rebuild cost-to-complete estimates monthly from remaining work, with controller review of every job where margin has changed more than 1 % | 5 | More reliable WIP; fewer surprises at completion |
| Record the school addition loss provision now and review Brookmere for a further provision | 4, 5 | Accurate statements; surety credibility |
| Pursue the Brookmere receivables using statutory payment and lien rights; stop work if necessary under the contract | 8, 10 | Release up to $470,000 of cash; reduce risk |
| Bill approved changes in the next claim and push pending changes to approval | 5, 8 | Reduce underbillings and improve adjusted working capital |
| Retain 2026 profits except a modest agreed distribution; consider a subordinated shareholder loan for any bonus | 9, 11 | Working capital above $3.0M; higher bonding capacity |
| Right-size the equipment fleet or adjust internal rates | 7 | Eliminate the $140,000 under-recovery |
| Slow growth to about 10 % until margins stabilize; bid selectively in familiar markets | 1, 6 | Protect margin and capacity |
| Present a 2026 plan and quarterly WIP schedules to the surety and bank | 11, 12 | Maintain support and credibility |
Worked problem
Quantifying the recommendations
If Kestrel collects $400,000 of the old Brookmere receivables, bills $500,000 of approved changes that were sitting in underbillings, records the $95,700 loss provision, and retains its planned 2026 net income of about $1.32 million less a $250,000 distribution, what happens to reported and adjusted working capital, assuming other items unchanged?
Show solution
- Collecting receivables converts one current asset to another: reported working capital unchanged; adjusted working capital improves by the 50 % previously deducted on $400,000 = +$200,000 (and the remaining $70,000 stays over 90 days).
- Billing approved changes moves $500,000 from underbillings to receivables: reported working capital unchanged; adjusted improves by 50 % of $500,000 = +$250,000.
- Recording the loss provision: reported working capital −$95,700; adjusted unchanged (it was already deducted).
- Retained profit: both +$1,070,000.
- Reported: 2,450,000 − 95,700 + 1,070,000 = about $3.42 million. Adjusted: 1,074,300 + 200,000 + 250,000 + 1,070,000 = about $2.59 million.
Answer: Reported working capital would rise to about $3.42 million and adjusted working capital to about $2.59 million, nearly two and a half times today's adjusted figure. At a 15 times multiple, that would support roughly $39 million of aggregate work, close to the size of the current backlog.
Closing the loop with the projects
The financial health of a contractor is built on site. Revenue and profit depend on the estimates project managers make every month; cash depends on how quickly they bill and close out; bonding capacity depends on whether their jobs finish as forecast. The tools in this course, the WIP schedule, the overhead and equipment budgets, the cash forecast and the ratios, are ways of seeing the projects as a whole and acting before small problems become fatal ones. A project manager who understands them can explain to the owners, the surety and the bank not just what happened on a job, but what it means for the company.
Common mistakes
MistakeJudging a contractor on one ratio or one year.
InsteadRead groups of ratios together and look at trends over three to five years.
MistakeComparing a firm with industry medians without adjusting for trade, size and policy.
InsteadUse benchmarks to spot outliers, then explain them; compare with similar firms.
MistakeTreating a screening score as a verdict.
InsteadUse it to prompt questions; check how sensitive the firm is to a single large loss.
MistakePlanning revenue without checking working capital and bonding.
InsteadModel the balance sheet and ratios that result from the plan, including a downside case.
MistakeCounting all the gross profit in backlog as certain.
InsteadDiscount it for the firm's history of fade.
MistakePresenting findings without actions.
InsteadTurn each finding into a specific recommendation with an expected effect and owner.
Summary and key terms
- Contractor ratios cover liquidity, leverage, profitability, efficiency, backlog and WIP quality; none is meaningful alone.
- Trends over several years reveal more than a single comparison with a benchmark.
- Screening scores such as Altman's Z″ highlight sensitivity to losses but are not verdicts.
- An annual plan connects backlog, new work, margins, overhead, equipment, distributions and cash to the resulting balance sheet.
- Scenario analysis shows how a downside would affect profit, working capital and bonding.
- Gross profit remaining in backlog compared with overhead shows how much pressure a firm is under to win work.
- A financial health review turns findings into specific, quantified recommendations rooted in project practice.
- Ratio analysis
- Using relationships between financial statement items to assess performance and condition.
- Benchmark
- A reference value, such as an industry median, used for comparison.
- Trend analysis
- Comparing a firm's own ratios over several periods.
- Return on equity
- Net income divided by average equity.
- Backlog to working capital
- Backlog divided by working capital; a measure of how far capital is stretched.
- Z'' score
- A weighted combination of four ratios used to screen non-manufacturing firms for distress risk.
- Financial plan
- A forecast of revenue, costs, cash and the balance sheet for the coming year.
- Scenario analysis
- Testing a plan under alternative assumptions, such as a downside case.
- Gross profit in backlog
- The gross profit expected on work not yet performed.
- Financial health review
- A structured assessment of a firm's financial condition with recommendations.
Practice problems
Work each problem on paper first, then reveal the answer to check.
Calculate Kestrel's revenue-to-equity ratio.
Show answer
58,400,000 ÷ 4,400,000 = 13.3.
Why is Kestrel's trend more worrying than its single-year ratios?
Show answer
Gross margin, working capital to revenue and completed-job results have deteriorated each year despite profits.
What are the four ratios in the Z″ score?
Show answer
Working capital/total assets, retained earnings/total assets, EBIT/total assets, equity/total liabilities.
Why should a Z″ score be used with care for contractors?
Show answer
It was not built for contractors and uses book values that depend on revenue recognition estimates.
A firm has $36 million of backlog and $3 million of monthly revenue. How many months of backlog does it have?
Show answer
12 months.
Backlog carries $2.4 million of gross profit and annual overhead is $3.6 million. How many months of overhead does it cover?
Show answer
8 months.
Name three elements of an annual financial plan.
Show answer
Revenue from backlog and new work, gross margin, overhead, equipment, distributions, cash and financing.
Why run a downside scenario?
Show answer
To see the effect on profit, working capital and bonding and to decide in advance what actions to take.
How does billing approved changes affect reported and adjusted working capital?
Show answer
Reported unchanged; adjusted rises because underbillings, which sureties discount, become receivables.
What is the single most effective way for Kestrel to raise its bonding capacity?
Show answer
Retain profits and clean up the balance sheet to raise adjusted working capital.
Lesson quiz · 5 questions
Score 60% or more to complete this lesson.
Create a free account to save your progress, take quizzes and earn a certificate.