
CON-320 · Lesson 8 of 12 · 29 min
Cash flow, working capital and the cash conversion cycle
Contractors rarely fail because they are unprofitable on paper; they fail because they run out of cash. Lesson 1 showed how growth can absorb a year's profit; Lesson 3 showed the working capital lines on Kestrel's cash flow statement. This lesson looks at cash management at the company level: what working capital is made of, how long cash is tied up in the operating cycle, how to forecast company cash over the next weeks and months, and what levers a contractor has to improve its position. CON-310 Lesson 11 covered the cash flow curve of a single project and the payment law that governs it; here we add up all the projects and the overhead to see the firm's position.
Working capital and its parts
Working capital is current assets minus current liabilities. For a contractor, it is both a measure of liquidity and the single most important figure for sureties and lenders, because it is the cushion that funds payroll and suppliers while the firm waits to be paid, and the first line of defense if a job goes wrong.
| Kestrel working capital at 31 December 2025 | $ | Days of revenue or cost |
|---|---|---|
| Cash | 2,850,000 | 17.8 days of revenue |
| Contract receivables, excluding holdback | 6,900,000 | 43.1 days of revenue |
| Retainage receivable | 2,700,000 | 16.9 days of revenue |
| Contract assets (underbillings) | 1,150,000 | 7.2 days of revenue |
| Other current assets | 350,000 | |
| Trade and subcontract payables | (5,800,000) | 39.6 days of contract cost |
| Retainage payable | (2,100,000) | 14.3 days of contract cost |
| Contract liabilities (overbillings) | (2,250,000) | 14.1 days of revenue |
| Accrued liabilities and current debt | (1,350,000) | |
| Working capital | 2,450,000 |
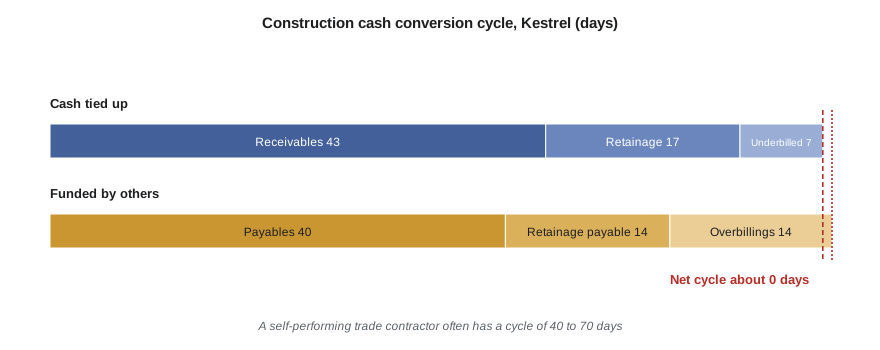
Expressing each item in days makes it easier to see what drives working capital. Kestrel's receivables represent about 43 days of revenue; if collection slowed to 55 days, about $1.9 million more cash would be tied up. Holdback ties up another 17 days. On the other side, Kestrel holds about 40 days of its costs in payables and 14 days in holdback owed to its subcontractors, and its overbillings provide 14 days of revenue in advance.
The cash conversion cycle
The cash conversion cycle measures how long a firm's cash is tied up between paying for its costs and collecting from customers. For a manufacturer, it is days of inventory plus days of receivables minus days of payables. Contractors hold little inventory, so a construction version uses receivables, holdback and underbillings on the asset side and payables, holdback payable and overbillings on the liability side.
In this version, DSO is days of receivables excluding holdback, DHR days of holdback receivable, DUB days of underbillings, DPO days of payables, DHP days of holdback payable and DOB days of overbillings. Receivable-side items are measured against revenue and payable-side items against contract cost.
revenue, cost = 58_400_000, 53_440_000
d_rev, d_cost = revenue / 365, cost / 365
assets = {"receivables": 6_900_000, "holdback receivable": 2_700_000, "underbillings": 1_150_000}
liabs = {"payables": 5_800_000, "holdback payable": 2_100_000}
overbillings = 2_250_000
tied = sum(v / d_rev for v in assets.values())
funded = sum(v / d_cost for v in liabs.values()) + overbillings / d_rev
for k, v in assets.items():
    print(f"{k:22} {v / d_rev:5.1f} days")
for k, v in liabs.items():
    print(f"{k:22} {v / d_cost:5.1f} days")
print(f"{'overbillings':22} {overbillings / d_rev:5.1f} days")
print(f"Cash conversion cycle: {tied - funded:5.1f} days")receivables 43.1 days holdback receivable 16.9 days underbillings 7.2 days payables 39.6 days holdback payable 14.3 days overbillings 14.1 days Cash conversion cycle: -0.8 days
Kestrel's cycle is close to zero: its subcontractors, suppliers and overbillings finance nearly all of the cash tied up in receivables, holdback and underbillings. That is typical of a general contractor that subcontracts most of its work and pays subcontractors after it is paid. A specialty trade contractor that self-performs most of its work pays weekly wages and has fewer subcontractors to lean on, so its cycle is usually much longer, perhaps 40 to 70 days, and its need for working capital per dollar of revenue is higher.
| Measure | General contractor (Kestrel) | Mechanical trade contractor (illustrative) |
|---|---|---|
| Days of receivables | 43 | 58 |
| Days of retainage receivable | 17 | 22 |
| Days of underbillings | 7 | 12 |
| Days of payables | 40 | 28 |
| Days of retainage payable | 14 | 4 |
| Days of overbillings | 14 | 9 |
| Cash conversion cycle | about 0 | about 51 |
A near-zero cycle is not a reason for complacency. It depends on paying subcontractors only after the owner pays, which payment legislation increasingly restricts (CON-310 Lesson 11), and on keeping overbillings, which unwind as jobs finish. If a large owner pays slowly, the general contractor may still have to pay its subcontractors within statutory deadlines, and the cycle lengthens quickly.
Forecasting company cash
A contractor should forecast its cash flow, not just its profit. Two horizons are common. A thirteen-week forecast, updated weekly, lists expected receipts and payments by week and shows when the line of credit will be needed. A twelve-month forecast, updated monthly, rolls up the project cash flows from each job's schedule and billing plan, adds expected new work from the backlog and pipeline, and deducts overhead, equipment purchases, debt payments, taxes and dividends.
| Source of forecast | Receipts | Payments |
|---|---|---|
| Open jobs | Billings by month from the schedule of values, collected after the owner's payment period; holdback released on completion and lien expiry | Subcontractor and supplier payments by their terms; payroll weekly or bi-weekly |
| Expected new work | Billings from projects likely to be awarded, with a delay for start-up | Mobilization and early costs |
| Company items | Equipment sales, interest income | Overhead, equipment purchases, loan payments, income tax installments, dividends |
import random
random.seed(8)
# 13-week company cash forecast (illustrative, in thousands)
opening = 2_850
receipts = [1_150, 980, 1_420, 860, 1_300, 1_050, 1_390, 900, 1_240, 1_120, 1_460, 870, 1_310]
payroll = [210, 0, 215, 0, 220, 0, 225, 0, 225, 0, 230, 0, 230]       # bi-weekly
subs_suppliers = [880, 1_150, 760, 1_240, 820, 1_180, 790, 1_260, 840, 1_200, 860, 1_250, 900]
overhead = [65] * 13
other = [0, 0, 180, 0, 0, 0, 95, 0, 0, 350, 0, 0, 0]    # loan payment, equipment, tax payment
cash, low = opening, (0, opening)
for wk in range(13):
    cash += receipts[wk] - payroll[wk] - subs_suppliers[wk] - overhead[wk] - other[wk]
    if cash < low[1]: low = (wk + 1, cash)
    print(f"Week {wk + 1:>2}: closing cash {cash:>6,}")
print(f"Lowest point: week {low[0]} at {low[1]:,} thousand")Week 1: closing cash 2,845 Week 2: closing cash 2,610 Week 3: closing cash 2,810 Week 4: closing cash 2,365 Week 5: closing cash 2,560 Week 6: closing cash 2,365 Week 7: closing cash 2,580 Week 8: closing cash 2,155 Week 9: closing cash 2,265 Week 10: closing cash 1,770 Week 11: closing cash 2,075 Week 12: closing cash 1,630 Week 13: closing cash 1,745 Lowest point: week 12 at 1,630 thousand
The forecast shows cash drifting down over the quarter, with a low point late in the period after a tax installment and a large subcontractor payment cycle. It does not go negative, but the cushion thins. Management can see this weeks ahead and decide whether to draw on the line of credit, chase a slow receivable, delay an equipment purchase or time a dividend differently. The point of a forecast is not accuracy to the dollar but early warning.
Levers on the receivables side
The fastest way to improve a contractor's cash is to bill fully and promptly and to collect what is billed. Many contractors leave cash on the table through slow or incomplete billing.
| Lever | What it means | Typical effect |
|---|---|---|
| Bill on time every period | Submit progress claims on the contract date with complete backup | Avoids a full month of delay |
| Bill approved changes promptly | Add change orders to the next claim as soon as approved | Reduces underbillings |
| Push for change approval | Escalate pending changes so work done can be billed | Converts unbilled costs to receivables |
| Follow up certification and payment | Track each claim through the certifier and owner; call on day one of lateness | Cuts days of receivables |
| Use statutory rights | Prompt pay notices, interest on late payment, mechanic's lien and bond claim rights | Gives leverage on slow payers (see CON-220) |
| Close out to release retainage | Finish deficiencies, documents and commissioning promptly | Releases the largest single receivable on each job |
| Check owner credit before bidding | Avoid owners with poor payment records or unclear financing | Prevents bad debts and slow jobs |
Worked problem
The value of faster collection
Kestrel's receivables excluding holdback are $6.9 million on revenue of $58.4 million, or about 43 days. If better billing and follow-up cut this to 36 days, how much cash is released, and what is it worth at 7 % a year?
Show solution
- Daily revenue = 58,400,000 ÷ 365 = $160,000.
- Days saved = 43.1 − 36 = 7.1; cash released = 7.1 × 160,000 = about $1,140,000.
- Annual value at 7 % = 0.07 × 1,140,000 = about $80,000.
Answer: Seven days faster collection releases about $1.1 million of cash, worth about $80,000 a year in avoided borrowing, and strengthens working capital in the surety's eyes.
Levers on the payables side
On the other side, a contractor can manage when it pays, within the law and its contracts. Paying subcontractors and suppliers on agreed terms, not early, preserves cash; paying them late damages relationships, risks liens and statutory penalties, and is noticed by sureties and credit agencies. Early-payment discounts from suppliers are often worth taking: a 2 % discount for paying in 10 days instead of 30 is equivalent to an annual return of over 36 %, far more than the cost of the line of credit.
Worked problem
A supplier discount
A concrete supplier offers 2 % off for payment within 10 days, otherwise net 30. Kestrel's line of credit costs 7.5 %. Should it pay early?
Show solution
- Annualized cost of skipping the discount = 0.02 ÷ 0.98 × 365 ÷ 20 = 0.0204 × 18.25 = about 37 %.
- Borrowing on the line costs 7.5 %.
Answer: Kestrel should take the discount, even if it has to borrow to do so; skipping it is like borrowing at about 37 %.
Pay-when-paid and pay-if-paid clauses, which tie a subcontractor's payment to the contractor's receipt of payment, are treated differently from state to state: some enforce pay-if-paid clauses, others treat them as unenforceable or read them as pay-when-paid timing provisions, and federal and state prompt payment acts set deadlines for paying subcontractors. Contractors cannot rely on such clauses to stretch payables without legal advice; CON-220 and CON-310 cover the details.
Growth and working capital
Because each dollar of revenue ties up some working capital, a growing contractor needs more working capital each year. The amount depends on the cash conversion cycle and the firm's mix of self-performed and subcontracted work. A useful planning question is how fast the firm can grow on its own profits without borrowing more or weakening its ratios. If the firm keeps its working capital at a fixed percentage of revenue, its sustainable growth rate is roughly its retained profit divided by the working capital it needs per dollar of revenue.
revenue, wc = 58_400_000, 2_450_000
wc_ratio = wc / revenue                      # working capital per revenue dollar
net_margin, payout = 0.021, 0.28             # after-tax margin and dividend share
retained = revenue * net_margin * (1 - payout)
# Assume equipment spending absorbs about 40 % of retained profit
available_for_wc = retained * 0.60
growth = available_for_wc / wc_ratio
print(f"Working capital per revenue dollar: {wc_ratio:.3f}")
print(f"Retained profit: {retained:,.0f}; available for working capital: {available_for_wc:,.0f}")
print(f"Revenue growth supportable at the same ratio: {growth:,.0f} "
f"({growth / revenue:.1%})")Working capital per revenue dollar: 0.042 Retained profit: 883,008; available for working capital: 529,805 Revenue growth supportable at the same ratio: 12,628,816 (21.6%)
On these assumptions, Kestrel can grow by about $13 million, or roughly 22 %, next year while keeping working capital at its current share of revenue. Its plan for $64 million is within that limit. A plan to reach $80 million would require more equity, more borrowing or a lower working capital ratio, and its surety would want to discuss how it would be financed and managed.
Liquidity measures
Beyond working capital, analysts use a few simple liquidity ratios. Each has a construction twist.
| Ratio | Formula | Kestrel | Comment |
|---|---|---|---|
| Current ratio | Current assets ÷ current liabilities | 1.21 | Sureties often look for at least 1.2 to 1.5 for general contractors |
| Quick ratio | (Cash + receivables, including holdback) ÷ current liabilities | 1.08 | Excludes underbillings and prepaid items, which are less liquid |
| Days of cash | Cash ÷ daily total costs (contract costs + overhead) | 18 | How long the firm could pay its bills with no receipts |
| Overbillings coverage | Cash ÷ overbillings | 1.27 | Below 1.0 suggests overbilling cash has been spent elsewhere |
| Working capital turnover | Revenue ÷ working capital | 23.8 | High turnover means little cushion per dollar of work |
Ratios are only signals, and they move with the business cycle and with the timing of the year-end. A contractor that collects a large holdback the week before year-end looks more liquid than one that collects it the week after. Lesson 12 discusses benchmarks and how to read trends rather than single values.
Common mistakes
MistakeManaging profit and ignoring cash.
InsteadForecast cash weekly over thirteen weeks and monthly over a year, and act on the low points.
MistakeBilling late or leaving approved changes off the claim.
InsteadBill fully and on time every period; push pending changes to approval so they can be billed.
MistakeTreating a near-zero cash conversion cycle as permanent.
InsteadIt depends on subcontractor terms and overbillings that unwind; slow owners or payment law can lengthen it quickly.
MistakeSkipping supplier discounts to save cash.
InsteadA 2 % discount for 20 days is worth about 37 % a year, far more than the line of credit costs.
MistakeRelying on pay-when-paid clauses to stretch payables.
InsteadPayment legislation restricts them; plan to pay subcontractors on statutory or contract terms.
MistakeGrowing faster than retained profits can finance.
InsteadEstimate sustainable growth from retained profit and working capital needs, and plan financing for anything faster.
Summary and key terms
- Working capital is the cushion that funds operations and the first figure sureties and lenders examine.
- Expressing receivables, holdback, underbillings, payables and overbillings in days shows what drives working capital.
- The construction cash conversion cycle nets days tied up in receivables, holdback and underbillings against days funded by payables, holdback payable and overbillings.
- General contractors often have short cycles; self-performing trade contractors have longer ones and need more working capital.
- A thirteen-week and a twelve-month cash forecast give early warning of shortfalls.
- Prompt, complete billing and collection are the fastest cash levers; supplier discounts are usually worth taking.
- Growth needs working capital; retained profits limit how fast a firm can grow without new financing.
- Cash conversion cycle
- The number of days cash is tied up between paying costs and collecting from customers.
- Days sales outstanding
- Receivables divided by daily revenue.
- Days payables outstanding
- Payables divided by daily cost.
- Thirteen-week cash forecast
- A weekly forecast of receipts and payments over the next quarter.
- Current ratio
- Current assets divided by current liabilities.
- Quick ratio
- Cash and receivables divided by current liabilities.
- Days of cash
- Cash divided by daily total costs.
- Early-payment discount
- A price reduction offered by a supplier for paying within a short period.
- Pay-when-paid clause
- A clause tying a subcontractor's payment timing to the contractor's receipt of payment.
- Sustainable growth
- The growth rate a firm can finance from retained profits at its current ratios.
Practice problems
Work each problem on paper first, then reveal the answer to check.
A firm has revenue of $36.5 million and receivables of $5.0 million. What are its days of receivables?
Show answer
Daily revenue $100,000; 50 days.
Why is a general contractor's cash conversion cycle often shorter than a trade contractor's?
Show answer
It subcontracts most work and pays subcontractors after it is paid, so payables and holdback payable offset receivables.
Kestrel's receivables fall from 43 to 38 days. How much cash is released?
Show answer
5 × 160,000 = about $800,000.
What is the annualized cost of forgoing a 1 % discount for paying in 10 days instead of 30?
Show answer
0.01 ÷ 0.99 × 365 ÷ 20 = about 18.4 %.
Name two items that belong in a company cash forecast but not a project cash flow.
Show answer
Overhead, equipment purchases, loan payments, tax installments, dividends.
What does overbillings coverage below 1.0 suggest?
Show answer
Cash collected in advance for future work has been spent elsewhere.
Calculate Kestrel's current ratio.
Show answer
13,950,000 ÷ 11,500,000 = 1.21.
Why do ratios at a single year-end need care?
Show answer
They depend on timing, such as collecting a large holdback just before or after year-end.
A firm needs 6 cents of working capital per revenue dollar and can add $600,000 to working capital. How much can it grow?
Show answer
$10 million.
What is the main purpose of a thirteen-week forecast?
Show answer
Early warning of cash shortfalls so management can act.
Lesson quiz · 5 questions
Score 60% or more to complete this lesson.
Create a free account to save your progress, take quizzes and earn a certificate.