
CRE-440 · Lesson 10 of 12 · 34 min
Competitive analysis and trend spotting
No creator works in a vacuum. Other creators compete for the same viewers' attention, sponsors compare channels before choosing partners, and topics rise and fall in popularity. Competitive analysis helps you understand where you stand and where the openings are. Trend spotting helps you decide which emerging topics and formats deserve a place in your plans, and when. Both can be done badly, by obsessively copying rivals or chasing every trend, or well, by using them to sharpen your positioning and feed your experiment backlog. This lesson covers how to identify competitors, analyze them fairly, separate real trends from noise, and time your response.
Who your competitors are
Your competitors are not only creators in your exact niche. Viewers choose between many ways of spending the same time. It helps to think in three rings.
- Direct competitors: creators making similar content for the same audience, such as other budget laptop reviewers.
- Adjacent competitors: creators serving the same audience with different content, or similar content for a different audience, such as general tech news channels or reviewers focused on gaming laptops.
- Substitutes: other ways the audience meets the same need, such as written review sites, retailer reviews, forums or asking friends.
Direct competitors show you what viewers in your niche already expect. Adjacent competitors and substitutes often reveal opportunities: formats or angles that work elsewhere but have not yet reached your niche.
What to analyze, fairly
A useful competitive review looks at a manageable set of five to ten creators and records consistent information for each.
| Dimension | What to record | Why it matters |
|---|---|---|
| Positioning | Audience, angle and promise | Shows gaps and crowded spaces |
| Formats and cadence | Lengths, series, upload frequency | Reveals what the audience has learned to expect |
| Performance pattern | Typical views and outliers relative to their own median | Shows which topics overperform |
| Packaging | Thumbnail and title styles | Suggests hypotheses for your own tests |
| Monetization | Sponsors, products, memberships | Shows what the audience pays for |
| Community | Comment themes, Discord, livestreams | Shows unmet needs and loyalty drivers |
The fairest way to compare performance across channels of different sizes is to measure each video against that channel's own typical level. An outlier score, a video's views divided by the channel's median views, shows which topics overperform for a given creator, regardless of channel size.
Worked problem
Finding overperforming topics with outlier scores
Competitor A has median views of 40,000; its video on battery life tests got 160,000. Competitor B has median views of 300,000; its video on keyboard comparisons got 450,000. Which topic overperformed more?
Show solution
- A: 160,000 ÷ 40,000 = 4.0 times its median.
- B: 450,000 ÷ 300,000 = 1.5 times its median.
Answer: The battery life video overperformed far more, at 4 times its channel's norm, even though it had fewer total views. Topics with high outlier scores across several channels are strong candidates for your own content and tests.
Remember survivorship bias from lesson 7: outliers are visible winners. Check whether the same topic underperformed elsewhere before concluding it is a reliable opportunity.
Positioning maps
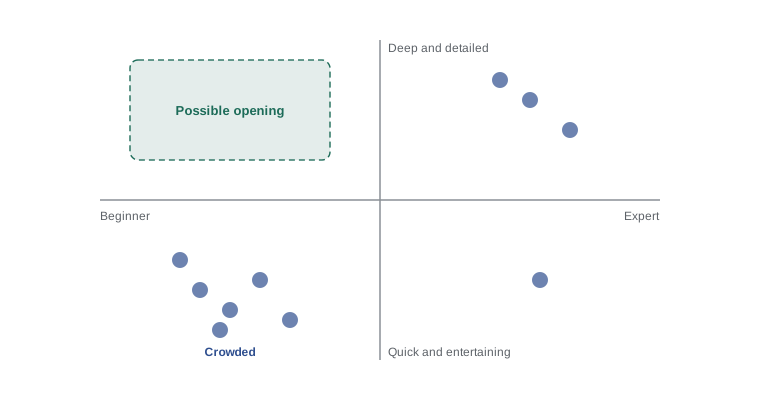
A positioning map plots creators on two dimensions that matter to the audience, such as depth versus entertainment, or beginner versus expert. Clusters show crowded spaces; empty areas show possible openings, though some areas are empty because there is no demand. A map is a thinking tool, not a precise measurement, but it often reveals where your channel could be more distinct.
Signals and noise in trends
A trend is a sustained change in interest, not a single spike. The challenge is that early trends and random spikes look similar at first. Tools such as Google Trends, platform search suggestions, TikTok's Creative Center, YouTube's research and inspiration tabs where available, and keyword research tools show interest over time, but every one of them is noisy. Several techniques help separate signal from noise.
- Smooth the data with a moving average, such as a four-week average, to see the underlying direction.
- Look for confirmation across sources: rising searches, rising creator coverage and rising audience requests together are stronger evidence than any one alone.
- Check persistence: a topic that rises for several consecutive weeks is more likely a trend than one that spikes and falls.
- Compare with last year to rule out seasonal patterns.
Worked problem
Smoothing a noisy interest series
Weekly search interest for a topic, on a 0 to 100 scale, is 20, 35, 22, 28, 30, 41, 33, 45. Calculate the four-week moving averages and describe the trend.
Show solution
- Weeks 1–4: (20 + 35 + 22 + 28) ÷ 4 = 26.25.
- Weeks 2–5: (35 + 22 + 28 + 30) ÷ 4 = 28.75.
- Weeks 3–6: (22 + 28 + 30 + 41) ÷ 4 = 30.25.
- Weeks 4–7: (28 + 30 + 41 + 33) ÷ 4 = 33.0.
- Weeks 5–8: (30 + 41 + 33 + 45) ÷ 4 = 37.25.
Answer: The raw numbers bounce up and down, but the moving average rises steadily from about 26 to about 37, a gain of around 42 % over five weeks. That persistent rise suggests a real trend rather than noise.
Growth rates and doubling time
When a trend is growing, its growth rate helps you judge urgency. A useful measure is doubling time: how long interest takes to double at the current growth rate. The rule of 70 gives a quick approximation: doubling time is roughly 70 divided by the percentage growth rate per period.
Worked problem
Estimating doubling time
Creator videos on a new topic are growing about 12 % per week. Roughly how long until the number of videos doubles, and what does that imply?
Show solution
- Rule of 70: 70 ÷ 12 ≈ 5.8 weeks.
- Check: 1.12⁶ ≈ 1.97, so about six weeks is right.
Answer: Coverage will roughly double in six weeks. If the creator takes eight weeks to research and produce a strong video, the topic may be much more crowded by then, which favors a quicker, smaller first video plus a deeper follow-up.
Timing: the trend curve
Many trends follow an S-shaped curve: a slow start, a rapid rise, a peak and then a plateau or decline. Your best response depends on where the trend is.
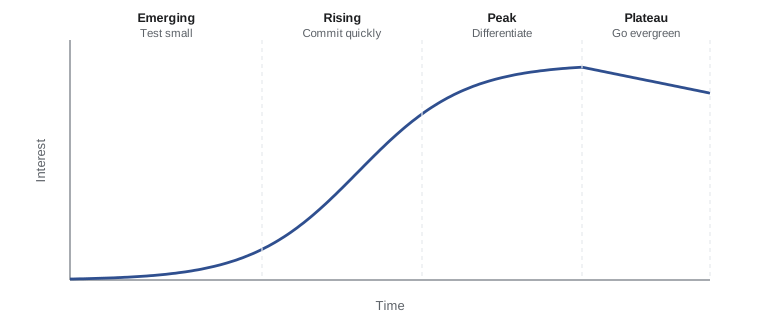
| Phase | Signs | Typical creator response |
|---|---|---|
| Emerging | Small, rising interest; few creators | Test cheaply; build expertise |
| Rising | Accelerating search and coverage | Commit with strong content quickly |
| Peak | Crowded; many similar videos | Differentiate with a unique angle, or skip |
| Plateau or decline | Interest stable or falling | Create evergreen reference content or move on |
Not every trend suits every creator. A trend that pulls you away from your positioning may bring views but damage the clarity of your channel. A useful filter asks three questions: does it fit my audience and promise, can I add something distinctive, and will the content still be useful after the peak?
Worked problem
Scoring trend fit
A creator scores a trending topic from 1 to 5 on audience fit (weight 0.4), ability to add something distinctive (0.3), evergreen value after the peak (0.2) and production ease (0.1). Scores are 4, 2, 2 and 5. Using a threshold of 3.5 to commit, what should they do?
Show solution
- Weighted score: 0.4 × 4 + 0.3 × 2 + 0.2 × 2 + 0.1 × 5 = 1.6 + 0.6 + 0.4 + 0.5 = 3.1.
Answer: The score of 3.1 is below the 3.5 threshold. The topic fits the audience but offers little distinctive angle or lasting value, so a quick short-form test is reasonable, but not a major investment.
Share of voice
Share of voice estimates how much of the conversation in a niche belongs to you. A simple version divides your views, mentions or search appearances on a set of niche keywords by the total for all tracked creators. It is a rough measure, but tracked over time it shows whether you are gaining or losing ground relative to competitors, independently of whether the whole niche is growing.
Worked problem
Calculating share of voice
Across ten key search terms in a niche, tracked creators earned 2,000,000 views last quarter, of which the creator earned 180,000. This quarter the total was 2,600,000 and the creator earned 210,000. Did the creator gain share?
Show solution
- Last quarter: 180,000 ÷ 2,000,000 = 9.0 %.
- This quarter: 210,000 ÷ 2,600,000 ≈ 8.1 %.
Answer: Although the creator's views grew about 17 %, the niche grew 30 %, so share of voice fell from 9.0 % to about 8.1 %. Competitors are capturing more of the niche's growth.
Learning without copying
Competitive analysis should inspire hypotheses, not imitation. Copying a rival's format, thumbnail style or script structure too closely can blur your positioning, irritate your audience and, if it involves copying protected material, raise copyright concerns. The productive approach is to ask why something works for a competitor, what principle lies underneath, and how you could apply that principle in a way that fits your own audience and moats. Then test it, following the methods in lessons 4 to 6, and record the result in your experiment log.
A competitive review routine
Competitive analysis is most useful as a light, regular habit rather than an occasional deep dive. A workable routine is a monthly scan of five to ten competitors' recent uploads, recording outlier videos and new formats, plus a quarterly review that updates the positioning map, share of voice and trend list. Keep the findings in the same log as your experiments, so that ideas from competitors flow naturally into your backlog with ICE scores.
Worked problem
Turning a competitive scan into tests
A monthly scan finds that three competitors' videos with "cost per serving" in the title scored outlier ratios of 3.2, 2.8 and 3.5, while their other videos averaged about 1.0. How should a cooking creator use this?
Show solution
- Average outlier score for the pattern: (3.2 + 2.8 + 3.5) ÷ 3 ≈ 3.2.
- Check the base rate: if many competitor titles mention cost and most do not overperform, the signal is weaker.
- If the pattern holds, write a hypothesis: adding cost per serving to titles will raise click-through rate.
Answer: Add a title test to the backlog and run it with Test & Compare. The competitor data justifies the test; it does not prove the effect for your audience.
Over time, this routine builds an evidence-based picture of your niche, keeps your positioning sharp and gives you a steady supply of well-grounded experiment ideas.
When the niche itself is shrinking
Sometimes competitive analysis reveals that the whole niche is declining: search interest falls year after year, competitors slow their uploads and sponsors move elsewhere. In that case, winning share of voice in a shrinking space is a weak strategy. Better options include widening the audience to an adjacent niche, shifting toward evergreen reference content that keeps steady demand, or repositioning the channel around a related, growing need. Treat such a shift as an exploration bet with stage gates, as described in lesson 9, rather than an overnight rebrand that risks losing your core audience.
Common mistakes
MistakeDefining competitors only as creators in the exact same niche.
InsteadInclude adjacent creators and substitutes, which often reveal opportunities.
MistakeComparing raw view counts across channels of different sizes.
InsteadUse outlier scores relative to each channel's median.
MistakeChasing every spike in search interest.
InsteadSmooth the data, check persistence and look for confirmation across sources.
MistakeJumping on trends that do not fit your audience.
InsteadFilter trends by fit, distinctiveness and lasting value before committing.
MistakeCopying competitors' formats closely.
InsteadExtract the underlying principle, adapt it to your positioning and test it.
Summary and key terms
- Competitors include direct rivals, adjacent creators and substitutes that meet the same need.
- A consistent review template covers positioning, formats, performance, packaging, monetization and community.
- Outlier scores compare a video with its own channel's median, enabling fair cross-channel comparison.
- Positioning maps reveal crowded spaces and possible openings.
- Moving averages, persistence and confirmation across sources separate trends from noise.
- The rule of 70 estimates doubling time; S-curve phases guide timing.
- Share of voice tracks relative position; learn from competitors without copying them.
- Direct competitor
- A creator making similar content for the same audience.
- Adjacent competitor
- A creator serving the same audience differently or similar content to a different audience.
- Substitute
- Another way the audience meets the same need.
- Outlier score
- A video's views divided by its channel's median views.
- Positioning map
- A chart placing creators on two dimensions that matter to the audience.
- Moving average
- An average over a rolling window used to smooth noisy data.
- Doubling time
- The time for a quantity to double at a constant growth rate.
- Rule of 70
- Doubling time is roughly 70 divided by the percentage growth rate per period.
- S-curve
- A pattern of slow start, rapid rise, peak and plateau.
- Share of voice
- A creator's share of total attention on a set of niche topics or keywords.
Practice problems
Work each problem on paper first, then reveal the answer to check.
Name the three rings of competition.
Show answer
Direct competitors, adjacent competitors and substitutes.
A video got 90,000 views on a channel with a 30,000 median. What is its outlier score?
Show answer
3.0.
Why use outlier scores instead of raw views?
Show answer
They control for channel size.
Four weeks of interest are 10, 14, 12, 16. What is the moving average?
Show answer
13.
Give two ways to separate a trend from a spike.
Show answer
Smoothing, persistence, confirmation across sources, comparing with last year.
Growth is 7 % per week. What is the doubling time?
Show answer
About 10 weeks.
What response suits a trend at its peak?
Show answer
Differentiate with a unique angle, or skip.
Scores 3, 4, 3, 2 with weights 0.4, 0.3, 0.2, 0.1. What is the total?
Show answer
1.2 + 1.2 + 0.6 + 0.2 = 3.2.
A creator has 150,000 of 1,500,000 niche views. What is their share of voice?
Show answer
10 %.
How should creators learn from competitors?
Show answer
Identify the underlying principle, adapt it and test it, rather than copying.
Lesson quiz · 5 questions
Score 60% or more to complete this lesson.
Create a free account to save your progress, take quizzes and earn a certificate.