
CRE-440 · Lesson 9 of 12 · 32 min
Portfolio strategy across platforms and formats
Every creator works with a fixed budget of time and energy. Each hour spent on one platform or format is an hour not spent on another. Portfolio thinking, borrowed from investing, treats those hours as investments with different expected returns and risks, and asks how to spread them for the best long-term outcome. This lesson applies portfolio ideas to creator strategy: risk and return across platforms and formats, diminishing returns, platform dependence and owned channels, and balancing proven work with exploration. CRE-302 introduced revenue diversification; here the focus is on allocating creative effort.
Risk and return for creators
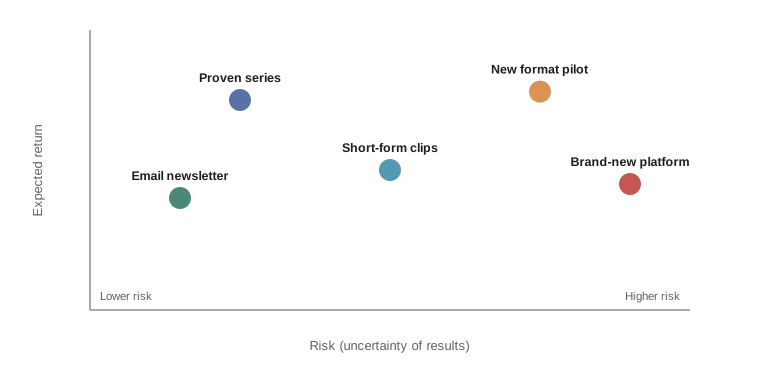
In investing, return is what you expect to gain and risk is how uncertain that gain is. For creators, return might be watch time, audience growth or income per hour of work, and risk is the chance that results are much lower than expected, or that a platform changes in a way that wipes out your progress. Different activities have different profiles.
| Activity | Typical return | Typical risk | Notes |
|---|---|---|---|
| Proven long-form series on home platform | Steady, predictable | Low to moderate | Core of most creator businesses |
| Short-form clips on a second platform | Variable discovery | Moderate | Reach can spike or vanish with algorithm changes |
| Email newsletter | Slow growth, durable | Low | Owned channel; not dependent on an algorithm |
| New format pilot | Uncertain, potentially large | High | Exploration; most fail, some become signature formats |
| Brand-new platform | Possible early-mover advantage | Very high | May grow or fade quickly |
Most creators benefit from a portfolio that is mostly lower-risk proven work, with a smaller allocation to higher-risk bets that could become the next growth engine.
Diminishing returns
The first hours spent on any platform or format usually produce the most value, and each additional hour produces a little less. The first short-form clip cut from a long video captures the best moment; the tenth captures weaker ones. The first hour of thumbnail design fixes obvious problems; the fifth adds polish few viewers notice. This is the principle of diminishing returns, and it is the main reason spreading effort across several activities can beat putting everything into one.
A simple way to model diminishing returns is to assume value grows with the square root of hours. Under that assumption, the best allocation equalizes the extra value from one more hour, called the marginal return, across activities.
Worked problem
Allocating hours with diminishing returns
A creator has 30 hours a week. Value on the home platform is modeled as 100√h and on a second platform as 60√h, in arbitrary value units. Compare putting all hours on the home platform, splitting equally, and the best split.
Show solution
- All on home: 100 × √30 ≈ 100 × 5.48 = 548.
- Equal split: 100 × √15 + 60 × √15 = 160 × 3.87 ≈ 620.
- Best split: \( h_A / h_B = (100/60)^2 \approx 2.78 \), so \( h_A = 30 \times 2.78 / 3.78 \approx 22 \) hours and \( h_B \approx 8 \) hours.
- Value at best split: 100 × √22 + 60 × √8 ≈ 469 + 170 = 639.
Answer: The best split, about 22 and 8 hours, produces about 639 units, 17 % more than putting everything on the home platform and slightly more than an equal split. The exact numbers depend on the model, but the lesson is general: the stronger platform deserves more time, not all of it.
Real creators do not know their value curves precisely. But estimating them roughly, for example by tracking results per hour as you shift time, helps you notice when the next hour would do more good elsewhere.
Platform dependence and owned channels
Platforms provide distribution, but they control the rules. A recommendation change, a policy update, a demonetization decision or an account problem can cut a creator's reach overnight. Dependence on a single platform is the creator equivalent of an investor holding a single stock. Diversifying across platforms helps, but every rented platform shares the same basic risk. Owned channels, such as an email list, a website, a podcast feed you control, or a membership community on a platform where you hold the member list, are the creator equivalent of a safer asset: slower to grow but much harder to take away.
Worked problem
Measuring platform dependence
A creator's monthly watch time comes 82 % from YouTube, 12 % from TikTok and 6 % from Instagram; they also have 4,000 email subscribers. If a YouTube recommendation change cut YouTube reach by 40 % for three months, what share of total watch time would be lost, and what does this suggest?
Show solution
- Loss: 82 % × 40 % = 32.8 % of total watch time.
- Remaining: 100 % − 32.8 % = 67.2 %.
- The email list provides a direct way to tell 4,000 people about new videos regardless of the algorithm.
Answer: A single platform change would cut a third of total watch time. Strengthening the email list and growing a second platform reduces that exposure, even if the home platform remains the priority.
Formats as a portfolio
The same logic applies to formats. A creator might run a flagship long-form series, a weekly short-form clip schedule, a monthly livestream and an occasional collaboration. Each format serves a role in the flywheel from lesson 1: short-form often drives discovery, long-form builds depth and trust, livestreams build community, and collaborations reach new audiences. A healthy format portfolio covers the weakest links in your flywheel.
| Format | Main role in the flywheel | Key metric |
|---|---|---|
| Short-form clips | Discovery of new viewers | New viewers who later watch long-form |
| Long-form videos | Depth, trust and watch time | Watch hours from returning viewers |
| Livestreams | Community and loyalty | Returning chat participants |
| Newsletter | Owned relationship | Active readers and click-through |
| Collaborations | Reaching adjacent audiences | New subscribers from collaboration traffic |
Exploit and explore
Creators face a constant tension between exploiting what already works and exploring new ideas that might work better. Exploit too much and the channel stagnates as audiences tire and platforms change. Explore too much and the core audience loses the content it came for. A common rule of thumb, borrowed from innovation management, is a 70/20/10 split: about 70 % of effort on core proven content, 20 % on adjacent improvements and extensions, and 10 % on genuinely new experiments. The exact ratio should fit your situation; a new channel may explore more, an established one less.
Worked problem
Applying a 70/20/10 split
A creator works 40 hours a week. Apply a 70/20/10 split, and estimate how many new-format pilot episodes they could make in a quarter if each pilot takes 12 hours.
Show solution
- Core: 70 % × 40 = 28 hours a week.
- Adjacent: 20 % × 40 = 8 hours a week.
- Exploration: 10 % × 40 = 4 hours a week, or about 4 × 13 = 52 hours per quarter.
- Pilots per quarter: 52 ÷ 12 ≈ 4.
Answer: About four pilot episodes a quarter, enough to give one new format a fair test each quarter without starving the core channel.
Stage gates for exploration
Exploration works best when each bet has clear review points, called stage gates, at which you decide whether to continue, adjust or stop. For a new format, the first gate might come after three episodes, checking a leading indicator such as retention or audience feedback; the second after eight episodes, checking growth and returning viewers; the third after a full quarter, checking whether it deserves a place in the core. Stopping a failing bet early frees time for the next one, and gates prevent the common trap of continuing a weak format because of effort already spent, known as the sunk cost fallacy.
Worked problem
A stage-gate decision with expected value
After three pilot episodes, a format's retention is above the channel median. The creator estimates a 35 % chance it becomes a core format worth 400 extra watch hours a month, and a 65 % chance it fades. Continuing to the next gate costs 36 hours of production. If one production hour on core content yields about 5 watch hours, should the creator continue?
Show solution
- Cost in watch hours forgone: 36 × 5 = 180 watch hours.
- If successful, value over the next six months: 400 × 6 = 2,400 watch hours.
- Expected value of continuing: 0.35 × 2,400 = 840 watch hours.
- Net expected gain: 840 − 180 = 660 watch hours.
Answer: Continue to the next gate. The expected payoff comfortably exceeds the cost. If the next gate's data lowers the success probability below about 8 % (180 ÷ 2,400 = 7.5 %), stopping would be the better choice.
Rebalancing
Investors rebalance portfolios periodically when some holdings grow and others shrink. Creators should do the same, perhaps each quarter. Review where your hours went, what each activity returned, and whether the balance still fits your strategy. A format that has become a major source of growth may deserve more time; a platform that has stalled for two quarters may deserve less. Rebalancing is easier when you have the data and experiment log built up in earlier lessons, and it feeds directly into the quarterly planning covered in lesson 11.
Cross-posting versus native content
A common portfolio question is whether to make content specifically for each platform or to repurpose the same material everywhere. Repurposing, such as cutting clips from long videos or posting the same vertical video on several short-form platforms, saves time and spreads risk. Native content, made with each platform's culture, length and features in mind, often performs better but costs more. Many creators combine the two: repurpose by default, then invest native effort where a platform has proven valuable.
Worked problem
Comparing repurposed and native clips
Repurposed clips take 1 hour each and average 4,000 views on a platform. Native clips take 3 hours each and average 10,000 views. With 12 hours a week for the platform, which approach yields more views?
Show solution
- Repurposed: 12 ÷ 1 = 12 clips × 4,000 = 48,000 views.
- Native: 12 ÷ 3 = 4 clips × 10,000 = 40,000 views.
- A mix of 6 repurposed and 2 native clips: 6 × 4,000 + 2 × 10,000 = 44,000 views.
Answer: Repurposing yields more total views here, but native clips get 2.5 times more views each, which may matter more if the goal is building recognition. Run the numbers on your own data before deciding, and remember that views alone may not reflect each approach's role in the flywheel.
Whatever the mix, track results per hour of effort by platform and format. That one habit makes most portfolio decisions much clearer.
Common mistakes
MistakePutting all effort into one platform because it currently performs best.
InsteadAccount for diminishing returns and platform risk; the best platform deserves more time, not all of it.
MistakeTreating every platform as equally important.
InsteadAllocate effort by marginal return and strategic role, not evenly by default.
MistakeNeglecting owned channels.
InsteadBuild an email list or other owned channel steadily to reduce dependence on algorithms.
MistakeExploring constantly without a stable core.
InsteadKeep most effort on proven content, with a deliberate share for exploration.
MistakeContinuing a weak format because of effort already spent.
InsteadUse stage gates and decide on expected future value, ignoring sunk costs.
Summary and key terms
- Portfolio thinking treats creative hours as investments with different returns and risks.
- Diminishing returns mean spreading effort can beat concentrating it; equalize marginal returns.
- Under a square-root model, the best hour split is proportional to the square of each activity's strength.
- Platform dependence is a major risk; owned channels such as email are harder to take away.
- Each format plays a role in the flywheel, such as discovery, depth or community.
- A 70/20/10 split balances core work, adjacent improvements and exploration.
- Stage gates and quarterly rebalancing keep the portfolio aligned with evidence.
- Portfolio
- A set of activities or investments managed together for overall return and risk.
- Risk
- Uncertainty about whether results will match expectations.
- Diminishing returns
- Each additional unit of effort produces less additional value.
- Marginal return
- The extra value produced by one more unit of effort.
- Platform dependence
- Reliance on one platform for most reach or income.
- Owned channel
- A channel the creator controls directly, such as an email list.
- Exploit and explore
- The balance between using proven approaches and trying new ones.
- 70/20/10 rule
- A rule of thumb allocating effort to core, adjacent and new work.
- Stage gate
- A planned review point for deciding whether to continue a project.
- Sunk cost fallacy
- Continuing an effort because of resources already spent rather than future value.
Practice problems
Work each problem on paper first, then reveal the answer to check.
Give one example each of a low-risk and a high-risk creator activity.
Show answer
Email newsletter or proven series; brand-new platform or new format pilot.
What does diminishing returns mean for creator hours?
Show answer
Each extra hour on one activity adds less value than the last.
Values 80√h and 40√h. What is the best ratio of hours?
Show answer
(80 ÷ 40)² = 4 to 1.
With 25 hours and a 4 to 1 ratio, how many hours go to each?
Show answer
20 and 5.
A platform provides 70 % of watch time and its reach falls 30 %. What share of total is lost?
Show answer
21 %.
Why are owned channels valuable?
Show answer
They do not depend on an algorithm and are hard to take away.
Name the main role of short-form clips in a flywheel.
Show answer
Discovery of new viewers.
Apply 70/20/10 to 30 hours.
Show answer
21 core, 6 adjacent, 3 exploration.
What is a stage gate?
Show answer
A planned review point to continue, adjust or stop a project.
Define the sunk cost fallacy.
Show answer
Continuing something because of past investment rather than future value.
Lesson quiz · 5 questions
Score 60% or more to complete this lesson.
Create a free account to save your progress, take quizzes and earn a certificate.