
CRE-440 · Lesson 5 of 12 · 33 min
Designing content experiments
Lesson 4 set out the experimental mindset. This lesson turns it into practical designs a creator can actually run. Each design trades off rigor against effort and what your platforms allow. The strongest designs randomize which viewers see which version at the same time; the weakest compare before and after a change and hope nothing else moved. Most creators use a mix, choosing the strongest design that fits each question. The lesson covers platform A/B tools, holdout designs, before-and-after comparisons with matching, switchback designs, cross-platform tests and multi-variant tests, then closes with a practical experiment brief.
A/B tests
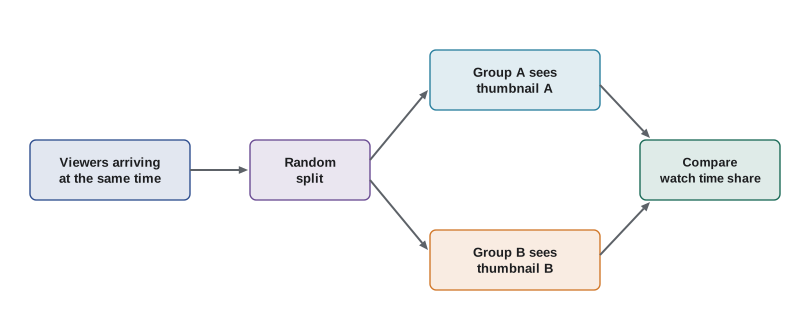
In an A/B test, viewers are randomly split between two versions, A and B, at the same time, and the results are compared. Because the split is random and simultaneous, topic, timing, season and algorithm changes affect both versions equally, so differences can be attributed to the change. A/B tests are the gold standard for questions about packaging, such as thumbnails and titles, because the platform can show different packaging for the same video to different viewers.
YouTube's Test & Compare feature, introduced for thumbnails in 2024, lets eligible creators upload up to three thumbnails for a video. YouTube shows them to different viewers and, rather than simply picking the highest click-through rate, reports the version that earns the greatest share of watch time, because a thumbnail that attracts clicks but disappoints viewers is not really better. Reporting in 2025 described YouTube expanding the feature to test titles as well for a group of creators. Exact eligibility, test length and the metrics shown change over time, so check YouTube's current help pages. Other platforms offer fewer built-in tools; some third-party services rotate thumbnails over time, which is a weaker design because versions are shown at different times rather than simultaneously.
Worked problem
Reading a thumbnail test
A three-way thumbnail test reports watch time shares of 41 % for thumbnail A, 35 % for B and 24 % for C. Click-through rates were 5.8 %, 6.4 % and 4.9 %. Which thumbnail should the creator keep, and why might it differ from the highest click-through rate?
Show solution
- Watch time share winner: A, at 41 %.
- Click-through winner: B, at 6.4 %.
- B attracts more clicks but viewers watch less after clicking, perhaps because the thumbnail promises something the video does not deliver quickly.
Answer: Keep thumbnail A. It generates the most watch time, which is closer to real value. B is a useful lesson: its style draws clicks, so consider whether the video's opening could match that promise.
Choosing the primary metric and guardrails
Every experiment needs one primary metric decided in advance, plus guardrails. For packaging tests, watch time per impression or watch time share is usually better than click-through rate alone. For content changes, such as intros or pacing, average percentage viewed or retention at a fixed point is common, with total watch time and comment sentiment as guardrails. For posting schedule changes, returning viewers and views in the first seven days are common primary metrics. Choosing several primary metrics and declaring victory if any improves is a common error that inflates false positives, discussed in lesson 6.
Holdout designs
Many changes cannot be shown to different viewers of the same video. A creator cannot show two different edits of a video at once on most platforms. One alternative is a holdout design: apply the change to some videos and keep it off a comparable set, chosen in advance, during the same period. For example, add chapter markers to half of this month's uploads, chosen by coin flip, and leave them off the other half. Because both groups are published in the same period, seasonal and algorithm effects are shared.
Worked problem
A randomized holdout across videos
A creator publishes 12 videos in a quarter and wants to test end-screen playlists. By coin flip, six videos get a playlist end screen and six get the standard end screen. Session watch time per view averages 11.4 minutes in the playlist group and 9.8 minutes in the standard group. What is the estimated effect?
Show solution
- Difference: 11.4 − 9.8 = 1.6 minutes per view.
- Relative lift: 1.6 ÷ 9.8 ≈ 16 %.
- Randomization by coin flip helps balance topics between groups, but with only six videos per group, one unusual video can sway the average.
Answer: The estimated effect is about 1.6 minutes, or 16 %. It looks promising; lesson 6 shows how to judge whether six videos per group is enough to trust it.
Randomizing which videos get the change matters. If the creator chooses, they may unconsciously put the change on stronger topics, biasing the result.
Before-and-after comparisons
The simplest design compares performance before a change with performance after it. It is easy but weak, because anything else that changed over the same period can explain the difference. Before-and-after comparisons can still be useful if you strengthen them.
- Use a long, stable baseline, such as the last 12 to 20 videos, rather than one or two.
- Compare like with like: similar topics, lengths and formats.
- Use the same time window for every video, such as the first 7 or 28 days.
- Adjust for seasonality where you have last year's data, as shown below.
- Look for a matched comparison, such as a similar channel or another platform that did not change.
Worked problem
Seasonally adjusting a before-and-after comparison
A creator changes intros in October. Average first-week views were 20,000 for September videos and 24,000 for October videos. Last year, with no change, October first-week views were 15 % higher than September's. What is the adjusted effect of the new intro?
Show solution
- Expected October views without the change: 20,000 × 1.15 = 23,000.
- Actual October views: 24,000.
- Adjusted effect: 24,000 − 23,000 = 1,000 views, or 1,000 ÷ 23,000 ≈ 4.3 %.
Answer: The raw before-and-after gain is 20 %, but most of it is seasonal. The adjusted effect of the intro is about 4 %, and even that should be treated cautiously.
Difference-in-differences
A stronger version of before-and-after uses a comparison group that did not change, and compares the change in the treated group with the change in the comparison group. This is called difference-in-differences. It removes effects that hit both groups, such as season or a platform-wide trend.
Worked problem
Difference-in-differences across two platforms
A creator adds captions with burned-in subtitles to TikTok videos in May but not to Instagram Reels, which carry the same content. Average watch time rose on TikTok from 9.0 to 11.5 seconds and on Instagram from 8.0 to 9.0 seconds. What is the estimated effect of burned-in subtitles?
Show solution
- TikTok change: 11.5 − 9.0 = 2.5 seconds.
- Instagram change: 9.0 − 8.0 = 1.0 second, reflecting content or seasonal effects common to both.
- Difference-in-differences: 2.5 − 1.0 = 1.5 seconds.
Answer: About 1.5 seconds of the TikTok gain can be attributed to subtitles. The method assumes both platforms would have moved together without the change, which is worth checking against earlier months.
Switchback and alternating designs
For changes that affect everything at once, such as posting time or frequency, a switchback design alternates conditions over time: for example, post at 9 a.m. one week, 5 p.m. the next, then 9 a.m. again, for several cycles. Because both conditions are repeated across different weeks, slow trends and one-off events tend to average out. Switchbacks need enough cycles, usually at least three or four of each condition, and some changes carry over between periods, which makes them less suitable.
Multi-variant and factorial tests
When you want to test more than two versions, or two variables at once, you need more traffic. Testing three thumbnails splits viewers three ways, so each version gets fewer impressions. A factorial test of two thumbnails crossed with two titles creates four combinations and can reveal interactions, such as a title that works only with a particular thumbnail. Small channels usually do better with simple A/B tests; larger channels can afford factorial designs.
Exploration versus optimization
It helps to separate two kinds of experiments. Optimization tests refine something that already works, such as thumbnails, titles, intros and posting times; effects are usually modest, perhaps a few percent. Exploration tests try something genuinely new, such as a new format, platform or series; effects can be large in either direction, and they usually need more patience because audiences and algorithms take time to respond. A healthy experiment program runs mostly optimization tests, with a small, deliberate share of exploration. Lesson 9 returns to this balance as portfolio strategy.
An experiment brief
Before running any experiment, fill in a short brief. It takes ten minutes and makes the result far more useful.
| Field | Example |
|---|---|
| Question | Does showing the finished project in the first 5 seconds keep more viewers? |
| Hypothesis | Early payoff will raise 30-second retention by at least 4 points |
| Design | Randomized holdout: 8 videos, 4 with the new opening by coin flip |
| Primary metric | Absolute retention at 30 seconds |
| Guardrails | Average view duration and negative comment share |
| Duration | First 7 days of each video, all published within 8 weeks |
| Decision rule | Adopt if lift is at least 4 points and guardrails hold; retest if 2 to 4 |
| Confounders to watch | Topic mix, a platform update, holiday weeks |
Common design problems
Even well-planned experiments run into practical problems. Knowing the common ones in advance helps you prevent them.
- Contamination: viewers in one group are exposed to the other condition, for example when a creator mentions the new format in an unchanged video. Keep conditions separate during the test.
- Unequal exposure: one version gets more impressions because of timing or placement. Check that groups received similar traffic before comparing.
- Too short a window: stopping after a day or two misses viewers who arrive later through search or suggestions. Use consistent windows, such as 7 or 28 days.
- Changing the plan mid-test: altering the thumbnail of a holdout video or swapping metrics halfway through undermines the comparison. Record any unavoidable changes.
- External shocks: a viral mention or platform outage during the test can swamp the effect. Note such events and consider excluding affected videos.
Worked problem
Checking exposure before comparing
In a holdout test, the treated videos received an average of 95,000 impressions and the control videos 60,000 because two treated videos were picked up by a news site. Treated videos averaged 18,000 views and control videos 12,000. Is the 50 % view difference a fair estimate of the change's effect?
Show solution
- Views per 1,000 impressions, treated: 18,000 ÷ 95 ≈ 189.
- Views per 1,000 impressions, control: 12,000 ÷ 60 = 200.
- Per impression, the treated videos actually did slightly worse.
Answer: No. The view difference comes from extra exposure caused by an external event, not the change. Comparing rates per impression, or excluding the two affected videos, gives a fairer picture.
Common mistakes
MistakePicking the thumbnail with the highest click-through rate alone.
InsteadPrefer watch time share or watch time per impression, with click-through as a supporting metric.
MistakeChoosing which videos get the change by hand.
InsteadRandomize assignment, for example by coin flip, to avoid unconscious bias.
MistakeTrusting a raw before-and-after comparison.
InsteadUse a long baseline, equal windows, seasonal adjustment or a comparison group.
MistakeDeclaring success if any of several metrics improves.
InsteadChoose one primary metric in advance and treat others as guardrails or secondary.
MistakeRunning factorial tests on a small channel.
InsteadUse simple A/B tests until you have enough traffic to split it many ways.
Summary and key terms
- A/B tests randomly split viewers between versions at the same time and are the strongest design for packaging.
- YouTube's Test & Compare reports the thumbnail with the highest watch time share; title testing expanded in 2025.
- Every experiment needs one pre-chosen primary metric and guardrails.
- Randomized holdouts apply a change to some videos and not others in the same period.
- Before-and-after comparisons are weak but can be strengthened with long baselines and seasonal adjustment.
- Difference-in-differences subtracts the change in a comparison group to remove shared trends.
- Switchbacks suit changes like posting time; exploration and optimization tests serve different purposes.
- A/B test
- An experiment that randomly shows two versions to different viewers at the same time.
- Watch time share
- The share of total watch time generated by each version in a test.
- Primary metric
- The single outcome chosen in advance to judge an experiment.
- Holdout
- A comparable set of content or viewers deliberately left without the change.
- Before-and-after comparison
- Comparing results from before a change with results after it.
- Seasonal adjustment
- Correcting results for predictable changes at certain times of year.
- Difference-in-differences
- An estimate of effect that subtracts the change in an untreated comparison group.
- Switchback design
- Alternating conditions over repeated time periods.
- Interaction
- When the effect of one variable depends on the level of another.
- Experiment brief
- A short plan recording the question, design, metrics and decision rule.
Practice problems
Work each problem on paper first, then reveal the answer to check.
Why is an A/B test stronger than a before-and-after comparison?
Show answer
Both versions run at the same time, so timing and other factors affect them equally.
What does YouTube's Test & Compare use to pick a winner?
Show answer
Watch time share.
Name two good guardrails for an intro test.
Show answer
Average view duration and comment sentiment, or total watch time.
Why randomize which videos receive a change?
Show answer
To avoid unconsciously putting the change on stronger topics.
September averaged 10,000 views; October 12,000. Last year October was 10 % higher. What is the adjusted effect?
Show answer
Expected 11,000; effect 1,000 views, about 9 %.
Treated group rose 3 units; comparison rose 1. What is the difference-in-differences estimate?
Show answer
2 units.
When is a switchback design useful?
Show answer
For changes that affect all content at once, such as posting time.
What is an interaction?
Show answer
When one variable's effect depends on another, such as a title working only with one thumbnail.
How do exploration and optimization tests differ?
Show answer
Optimization refines what works with modest effects; exploration tries new things with large, uncertain effects.
List four fields of an experiment brief.
Show answer
Question, hypothesis, design, primary metric, guardrails, duration, decision rule, confounders.
Lesson quiz · 5 questions
Score 60% or more to complete this lesson.
Create a free account to save your progress, take quizzes and earn a certificate.