
CRE-440 · Lesson 2 of 12 · 28 min
Goals and metrics: north stars, inputs and OKRs
A strategy becomes useful when it is translated into goals you can track. Without measurable goals, it is hard to tell whether a strategy is working, whether an experiment succeeded, or whether a busy month actually moved the business forward. With the wrong goals, the problem is worse: creators can work very hard optimizing a number that does not matter, or that even damages what they are trying to build. This lesson explains how to choose a north-star metric, how to separate the inputs you control from the outputs you hope for, how to avoid vanity metrics, and how to write and score objectives and key results (OKRs).
Why metrics need care
A famous observation, often called Goodhart's law, says that when a measure becomes a target, it ceases to be a good measure. Creators see this constantly. If a creator targets view counts above everything, titles drift toward clickbait, viewers feel misled, and average view duration falls. If a creator targets upload frequency, quality slips. If a creator targets follower count, they may run giveaways that attract people who never watch again. In each case, the number goes up while the thing it was supposed to represent, an engaged audience that trusts the creator, gets weaker.
The answer is not to stop measuring. It is to choose metrics that are closely tied to real value, to track a small set of them together so that gaming one shows up in another, and to keep asking what behavior a metric is encouraging.
The north-star metric
A north-star metric is the single number that best captures the value you create for your audience and that, if it grows sustainably, tends to make the rest of the business grow too. It gives everyone on a creator team, even a team of one, a shared answer to the question, "Are we getting better?" A good north-star metric has several properties.
- It reflects value to the audience, not just activity. Watch time, returning viewers and completed lessons say more about value than uploads or impressions.
- It leads revenue. When it grows, income tends to follow over the following months.
- It is measurable regularly, at least weekly or monthly, from data you can access.
- It is hard to game without creating real value.
- It is simple enough to remember and explain.
| Creator type | Possible north-star metric | Why it fits |
|---|---|---|
| Educational YouTube channel | Monthly watch hours from returning viewers | Rewards depth and loyalty, not one-off clicks |
| Short-form entertainment creator | Weekly engaged viewers across platforms | Captures reach while filtering accidental views |
| Newsletter writer | Weekly readers who open at least three of four issues | Measures habit, not list size |
| Course creator | Students completing a module each month | Completion predicts results and referrals |
| Podcaster | Listeners who finish 75 % or more of an episode | Signals real attention for sponsors |
There is no universally correct north star. A gaming streamer may use average concurrent viewers; a recipe creator may use saves plus returning viewers. The choice should follow from the vision and positioning set in lesson 1.
Inputs and outputs
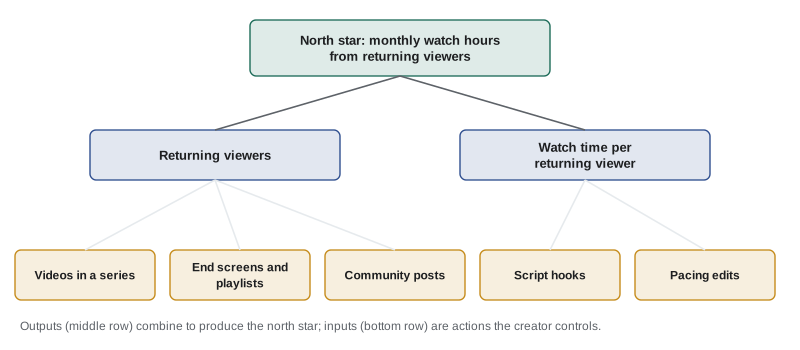
Most of the numbers creators watch are outputs: views, subscribers, watch time, revenue. Outputs are what you want, but you cannot control them directly; the algorithm, the season, the news cycle and luck all play a part. Inputs are the actions you control that you believe drive the outputs: the number of videos published, the hours spent on scripting, the number of thumbnails tested, the share of videos that are part of a series, the number of community replies each week.
A useful metrics system links the two in a metric tree. At the top is the north star. Below it are the outputs that combine to produce it. At the bottom are the inputs you can change this week.
Worked problem
Building a north-star calculation
An educational creator defines the north star as monthly watch hours from returning viewers. Last month there were 12,000 returning viewers, each watching an average of 50 minutes. What is the north-star value, and what happens if returning viewers rise 10 % and minutes per returning viewer rise 6 %?
Show solution
- Current value: 12,000 × 50 minutes = 600,000 minutes = 10,000 hours.
- New returning viewers: 12,000 × 1.10 = 13,200.
- New minutes per viewer: 50 × 1.06 = 53.
- New value: 13,200 × 53 = 699,600 minutes ≈ 11,660 hours.
- Growth: 11,660 ÷ 10,000 − 1 ≈ 16.6 %.
Answer: The north star rises from 10,000 to about 11,660 hours, a gain of about 16.6 %. Because the metric multiplies two components, small improvements in each compound: 1.10 × 1.06 = 1.166.
Leading and lagging indicators
Outputs differ in how quickly they respond. Lagging indicators, such as annual revenue or subscriber totals, change slowly and tell you about the past. Leading indicators, such as click-through rate on new uploads, the share of viewers who return within a week, or email sign-ups per video, move earlier and predict where lagging indicators will go. A balanced dashboard includes a few of each, so you can react early without forgetting the results that pay the bills.
Vanity metrics and actionable metrics
A vanity metric is a number that looks impressive but does not help you make decisions or reflect real value. Total lifetime views, raw follower counts, and impressions are common examples. They tend to go up over time almost regardless of what you do, and they say little about whether people are getting value. Actionable metrics, by contrast, change in response to your decisions and point to what to do next.
| Vanity metric | More actionable alternative |
|---|---|
| Total followers | Followers gained per 1,000 views on new posts |
| Lifetime views | Views in the first 7 days per new upload, compared with your median |
| Impressions | Click-through rate by traffic source |
| Total likes | Share or save rate per 1,000 views |
| Email list size | Active readers who opened in the last 90 days |
Ratios and rates are usually more actionable than totals, because they control for size. A rate also lets you compare videos fairly: 6,000 shares on a video with two million views is a lower share rate than 900 shares on a video with 60,000 views.
Worked problem
Comparing rates instead of totals
Video A has 2,000,000 views and 6,000 shares. Video B has 60,000 views and 900 shares. Which has the higher share rate per 1,000 views?
Show solution
- Video A: 6,000 ÷ 2,000,000 × 1,000 = 3 shares per 1,000 views.
- Video B: 900 ÷ 60,000 × 1,000 = 15 shares per 1,000 views.
Answer: Video B is five times more shareable per view. It may be the better model for future content, even though Video A has far more total shares.
Guardrail metrics
When you push hard on one metric, something else can break. Guardrail metrics are numbers you watch to make sure a change is not causing hidden damage. If you test punchier titles to raise click-through rate, average view duration and the share of negative comments are good guardrails: if clicks rise but viewers leave quickly or complain about misleading titles, the change is not a real improvement. If you increase upload frequency, guardrails might include average quality scores from a small viewer panel and your own hours worked per week. Lesson 5 returns to guardrails when designing experiments.
Objectives and key results
OKRs are a goal-setting method used widely in technology companies and adaptable to creator businesses. An objective is a short, qualitative statement of what you want to achieve. Key results are two to five measurable outcomes that show whether the objective has been achieved. OKRs are usually set each quarter, with a yearly set for direction.
- Objective: Become the go-to channel for first-time homeowners in Canada.
- Key result 1: Increase returning viewers from 12,000 to 15,000 per month.
- Key result 2: Grow the email list's active readers from 2,000 to 3,500.
- Key result 3: Publish a 6-part beginner series with average view duration above 45 %.
Good key results are outcomes, not tasks. "Publish six videos" is a task; "six videos with average view duration above 45 %" adds a quality outcome. Many teams also write initiatives, the projects they plan to do, separately from key results so the two are not confused.
Scoring OKRs
A common convention scores each key result between 0 and 1 at the end of the period, based on progress from the starting value toward the target. The score is (actual − start) ÷ (target − start), capped at 1. OKRs are often set to be ambitious, so a score of around 0.6 to 0.7 is usually considered good; consistently scoring 1.0 suggests the targets were too easy.
Worked problem
Scoring a quarter's OKRs
Key result 1 went from 12,000 to 14,100 returning viewers against a target of 15,000. Key result 2 went from 2,000 to 3,500 active readers against a target of 3,500. Key result 3 achieved 40 % average view duration against a target of 45 %, starting from 38 %. Score each key result and the objective as the average.
Show solution
- KR1: (14,100 − 12,000) ÷ (15,000 − 12,000) = 2,100 ÷ 3,000 = 0.70.
- KR2: (3,500 − 2,000) ÷ (3,500 − 2,000) = 1.00.
- KR3: (40 − 38) ÷ (45 − 38) = 2 ÷ 7 ≈ 0.29.
- Objective average: (0.70 + 1.00 + 0.29) ÷ 3 ≈ 0.66.
Answer: The objective scores about 0.66, a solid result for ambitious OKRs. The low KR3 score points to the next quarter's focus: improving retention on the beginner series.
How many metrics to track
A small creator does not need a dashboard with fifty numbers. A practical set is one north-star metric, three to five supporting outputs, two or three guardrails, and a short list of inputs for the current quarter. More than that tends to produce noise and distraction. Review the dashboard weekly for leading indicators and monthly for the rest, and resist checking real-time numbers many times a day: as later lessons show, short-term data is noisy and easy to misread.
Reviewing metrics as the channel changes
Metrics that suit a channel at one stage may not suit it later. A new channel may reasonably focus on discovery measures such as new viewers per upload, because there is not yet a returning audience to measure. A mature channel usually shifts toward loyalty and revenue measures. Review your north star and supporting metrics at each annual planning session and ask whether they still reflect the value you are trying to create. If you change a metric, record the date and the reason, and keep reporting the old metric alongside the new one for a quarter so that trends remain comparable.
Common mistakes
MistakeOptimizing a single number such as views at all costs.
InsteadPair the main metric with guardrails such as view duration and comment sentiment so gaming shows up.
MistakeChoosing a north star that measures activity, like uploads.
InsteadChoose a metric that reflects audience value and leads revenue, such as returning watch time.
MistakeComparing videos by totals.
InsteadUse rates per 1,000 views or per impression to compare fairly across different sizes.
MistakeWriting key results as tasks.
InsteadWrite measurable outcomes, and list the projects separately as initiatives.
MistakeExpecting to score 1.0 on every OKR.
InsteadSet ambitious OKRs where about 0.6 to 0.7 is a good result.
Summary and key terms
- Goodhart's law warns that metrics turned into targets can be gamed, so choose and pair them carefully.
- A north-star metric captures audience value, leads revenue, is measurable and hard to game.
- Metric trees connect the north star to outputs and to controllable inputs.
- Leading indicators move early and predict lagging indicators such as revenue.
- Rates are usually more actionable than totals; vanity metrics look good but guide nothing.
- Guardrail metrics catch hidden damage when you push one number.
- OKRs pair a qualitative objective with measurable key results, scored from 0 to 1.
- Goodhart's law
- The observation that a measure turned into a target stops being a good measure.
- North-star metric
- The single metric that best captures value to the audience and leads business growth.
- Input metric
- A measure of an action the creator controls, such as videos in a series.
- Output metric
- A measure of results the creator wants but cannot directly control, such as views.
- Metric tree
- A diagram linking a top metric to the outputs and inputs that drive it.
- Leading indicator
- A metric that changes early and predicts later results.
- Lagging indicator
- A metric that changes slowly and reflects past performance.
- Vanity metric
- An impressive-looking number that does not support decisions.
- Guardrail metric
- A metric watched to make sure an improvement elsewhere is not causing harm.
- OKR
- Objectives and key results: a qualitative goal paired with measurable outcomes.
Practice problems
Work each problem on paper first, then reveal the answer to check.
State Goodhart's law in your own words.
Show answer
When you make a number the target, people find ways to raise it that no longer reflect real value.
Give two properties of a good north-star metric.
Show answer
Reflects audience value, leads revenue, measurable regularly, hard to game, simple.
Is "videos published per month" an input or output?
Show answer
An input.
15,000 returning viewers watch 40 minutes each. What is the north star in hours?
Show answer
15,000 × 40 = 600,000 minutes = 10,000 hours.
Name one leading indicator for a YouTube channel.
Show answer
Click-through rate on new uploads, or returning viewers within a week.
A video has 300 saves on 20,000 views. What is the save rate per 1,000 views?
Show answer
15 saves per 1,000 views.
Why are total followers a vanity metric?
Show answer
They rise over time regardless of decisions and say little about engagement.
Give a guardrail for a click-through-rate test.
Show answer
Average view duration or negative comment share.
A KR went from 100 to 160 against a target of 200. What is its score?
Show answer
(160 − 100) ÷ (200 − 100) = 0.6.
What is the difference between a key result and an initiative?
Show answer
A key result is a measurable outcome; an initiative is a project you plan to do.
Lesson quiz · 5 questions
Score 60% or more to complete this lesson.
Create a free account to save your progress, take quizzes and earn a certificate.