
SLS-214 · Lesson 1 of 12 · 18 min
Why sales teams measure
▶ Video coming soon A video version of this lesson is on the way.
On Friday, September 18, 2026, Maya Chen walked into the small boardroom at Ridgeline Workplace Solutions carrying a coffee and a printed copy of her first three weeks of activity. Grace Liu, the company's sales operations analyst, had invited her to what Grace called "numbers sessions": ninety minutes every Friday morning through the fall, where Grace would teach Maya how the sales team measured itself and how it predicted what would happen next. Darnell Brooks, Maya's manager, had arranged the sessions because, as he put it, "good salespeople who can't read their own numbers end up working hard on the wrong things."
Grace began with a question that Rob Kowalski, the vice-president of sales, had asked her that week. "Rob wants to know whether we are going to make the year," she said. "Ridgeline's fiscal year runs from December 1 to November 30. We have ten weeks left. How would you answer him?" Maya admitted she would not know where to start. Grace smiled. "That is what this course is for. By the end of the fall you will be able to answer that question for yourself, for your territory and for the team, and you will know how sure you can be of the answer."
This course is about the numbers behind selling: what sales teams count, how they turn counts into rates and ratios, how they set targets, how they predict future revenue and how they use all of it to decide what to do on Monday morning. The main tool throughout is the spreadsheet, because almost every sales team, whatever CRM it uses, ends up exporting data into a spreadsheet to analyze it. SLS-140 introduced the CRM records that hold the raw data. This course is about what to do with them.
What measurement is for
Sales teams measure for four main reasons, and each one shapes what they count.
| Purpose | Question it answers | Example at Ridgeline |
|---|---|---|
| Planning | How much can we sell, and what do we need to do it? | Setting next year's quotas and hiring plan |
| Forecasting | How much will we sell this period? | Rob's question about the fiscal year |
| Diagnosis | Why are results what they are? | Working out why the summer quarter fell short |
| Coaching | Where should one seller spend effort to improve? | Darnell reviewing Maya's conversion rates |
These purposes overlap, but they are not the same. A forecast needs to be accurate; a coaching metric needs to be something the seller can change. A metric that is perfect for one purpose can be useless for another. Total revenue for the year is essential for planning, but it is a poor coaching tool, because by the time it is known the year is over.
Leading and lagging indicators
The most useful distinction in sales measurement is between lagging indicators and leading indicators. A lagging indicator records an outcome after it has happened: revenue booked, deals won, quota attained. A leading indicator measures something that tends to happen before the outcome and helps predict it: first meetings held, qualified opportunities created, proposals sent, pipeline value. Lagging indicators tell a team where it ended up. Leading indicators give it time to change course.
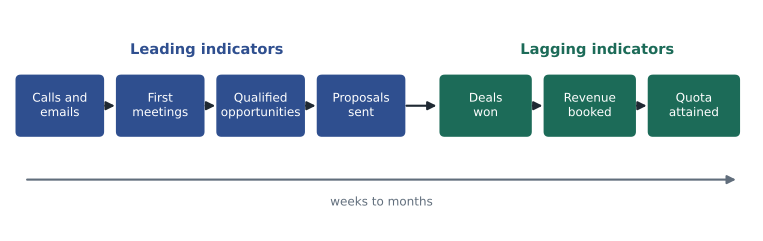
At Ridgeline, a managed print deal usually takes about two months from the first meeting to a signature, so the number of first meetings Maya holds in September is a good early signal of what she will close in November. If she waits until November to look at her closed deals, it is too late to fix a September shortfall in meetings. Grace put it this way: "Revenue is the score. Activity and pipeline are how you play the game. You can't change the score directly; you can only change how you play."
Leading indicators have a weakness, though. They predict outcomes only if the relationship between them holds. If Maya holds forty first meetings with poorly chosen prospects, her meeting count looks healthy but her wins will not follow. That is why the course spends so much time on rates that connect one stage to the next, such as the share of first meetings that become qualified opportunities.
What Ridgeline measures
Grace showed Maya the measures the sales team reviewed each week. They fell into three layers, which lesson 2 covers in detail.
| Layer | Examples | Reviewed |
|---|---|---|
| Activity | Calls, emails, first meetings, site visits, demos | Weekly, by each seller and Darnell |
| Pipeline | Number and value of open opportunities by stage, pipeline coverage, deals past their close date | Weekly, in the pipeline review |
| Outcome | Deals won and lost, revenue booked, win rate, quota attainment | Monthly and quarterly, by Rob and the leadership team |
Each layer answers a different question. Activity measures answer "is the seller doing the work?" Pipeline measures answer "is the work turning into future business?" Outcome measures answer "did it pay off?" A seller who is weak in only one layer usually has a specific, fixable problem.
Answering Rob's question
Grace walked Maya through a first, rough answer to Rob's question, using the numbers the leadership team already had. The answer used only arithmetic, but it showed how quickly a few numbers can frame a conversation.
Worked problem
Is the team on track for the fiscal year?
Ridgeline's five established field account executives share a fiscal-year quota of 3,000,000 dollars of new first-year revenue, set at 750,000 dollars a quarter. They booked 701,000 dollars in the first quarter (December to February), 744,000 dollars in the second (March to May) and 591,000 dollars in the third (June to August). How much have they booked so far, what share of the annual quota is that, and how much do they need in the fourth quarter to finish at 100 in 100?
Show solution
- Add the three quarters.
- \[701{,}000 + 744{,}000 + 591{,}000 = 2{,}036{,}000 \text{ dollars}\]
- Divide by the annual quota to get the share attained.
- \[\frac{2{,}036{,}000}{3{,}000{,}000} = 0.679 \approx 67.9 \text{ in } 100\]
- Three of four quarters have passed, so an even pace would be 75 in 100. The team is behind that pace.
- Subtract what has been booked from the annual quota.
- \[3{,}000{,}000 - 2{,}036{,}000 = 964{,}000 \text{ dollars}\]
- Compare that with the normal quarterly quota of 750,000 dollars.
- \[\frac{964{,}000}{750{,}000} = 1.29\]
Answer: The team has booked 2,036,000 dollars, about 67.9 in 100 of its annual quota, against an even pace of 75. To finish the year at quota it needs 964,000 dollars in the fourth quarter, about 1.29 times a normal quarter, which no quarter this year has reached.
This is a typical first answer: it does not say whether the team will make the year, but it shows what would have to happen. Grace said the next step was to look at the pipeline: were there enough deals expected to close by November 30 to make 964,000 dollars plausible? Lessons 7 and 8 return to that question, and the case study in lesson 12 looks at why the third quarter fell short.
Rates, ratios and averages
Most sales metrics are not raw counts but rates and ratios: one number divided by another. Win rate is deals won divided by deals closed. Conversion rate is the number of opportunities that reach a stage divided by the number that entered the stage before it. Average deal size is total revenue divided by the number of deals. Rates let a team compare a seller who works a large territory with one who works a small one, or this quarter with last quarter.
Rates need care. Every rate has a numerator and a denominator, and two people can calculate "the same" rate differently by choosing different denominators. Lesson 5 shows how a win rate can be 24 in 100 or 52 in 100 for the same quarter, depending on which lost deals are counted. Grace's rule was simple: "Whenever someone gives you a rate, ask what was divided by what."
Averages need the same care. An average deal size of 21,500 dollars might come from twenty deals of about that size, or from nineteen small deals and one very large school division contract. Lesson 5 introduces the median, the middle value when the numbers are sorted, which is much less affected by one unusual deal.
How measurement can go wrong
Measurement changes behavior, and not always for the better. The economist Charles Goodhart observed that when a measure becomes a target, people find ways to hit the target that do not achieve the goal behind it. This is usually called Goodhart's law. Sales offers many examples.
| Target | How it can be gamed | What it does to the business |
|---|---|---|
| Number of calls per day | Short calls to numbers that will not answer | Activity rises, conversations do not |
| Pipeline value | Opportunities created for prospects with no real need | Forecasts become unreliable |
| Win rate | Closing lost deals late or not entering hard opportunities | The team stops pursuing difficult but valuable accounts |
| Quarterly bookings | Pulling deals forward with discounts at quarter end | Margins fall and next quarter starts empty |
Ridgeline had learned some of these lessons the hard way. In 2024 the company had paid a bonus for the number of opportunities created, and the CRM filled with opportunities that never moved. Grace's clean-up that October, described in SLS-140, still found traces of it. The fix was not to stop measuring, but to measure several things that balance each other: opportunities created and the share that advance; bookings and average discount; calls and meetings held.
A second way measurement goes wrong is through bad data. If sellers do not update stages and close dates, every pipeline metric is wrong. SLS-140 covered data quality in detail. For this course, the important point is that analysis cannot be better than the records it uses. Grace spent part of every Friday checking the data before she analyzed it.
Measuring the right thing at the right level
The same metric can mean different things at different levels. A team's win rate of 25 in 100 says little about any one seller, because it averages people who win half their deals with people who win one in ten. A seller's monthly win rate, on the other hand, may be based on only three or four deals, so it jumps around from month to month for reasons that have nothing to do with skill. Grace advised Maya to judge her own rates over at least a quarter and to compare them with the team's over the same period.
This is a question of sample size. A rate based on a handful of events is noisy; the same seller doing the same work could easily show very different numbers in two months. A useful habit is to state the count behind every rate: not "my win rate is 50 in 100" but "I won 2 of 4." The count tells the listener how much weight the rate can bear.
A first look at the course
The rest of the course follows Grace's Friday sessions with Maya, with Darnell and Rob joining some weeks. Lessons 2 to 6 build up the measures: activity, pipeline and outcome metrics; conversion rates; sales velocity; win rates and cycle length; and quotas. Lessons 7 and 8 use them to forecast, first mechanically with a weighted pipeline and then with forecast categories and judgment. Lessons 9 to 11 cover territory data, spreadsheet skills and dashboards. Lesson 12 brings everything together to diagnose a missed quarter and plan the next one.
The course uses Ridgeline's numbers throughout, so the same figures appear in several lessons. That is deliberate: real analysis means looking at the same business from several angles until a consistent story appears.
Common mistakes
MistakeLooking only at revenue to judge how the team is doing.
InsteadTrack leading indicators such as meetings and pipeline as well, because they give time to act.
MistakeQuoting a rate without its numerator and denominator.
InsteadSay what was divided by what, and give the counts behind the rate.
MistakeSetting a single metric as a target and paying people to hit it.
InsteadUse balanced metrics that check each other, so gaming one shows up in another.
MistakeJudging a seller on one month of data.
InsteadUse at least a quarter, and compare with the team over the same period.
MistakeAnalyzing data without checking it first.
InsteadCheck stages, close dates and duplicates before drawing conclusions.
Summary and key terms
- Sales teams measure to plan, forecast, diagnose and coach, and each purpose needs different measures.
- Lagging indicators record outcomes such as revenue; leading indicators such as meetings and pipeline come earlier and give time to act.
- Ridgeline groups its measures into activity, pipeline and outcome layers.
- Simple arithmetic frames big questions: the team had booked 2,036,000 dollars, about 67.9 in 100 of its annual quota, and needed 964,000 dollars in the last quarter.
- Most metrics are rates, ratios or averages, so always ask what was divided by what.
- Goodhart's law warns that a measure used as a target can be gamed.
- Small samples make rates noisy.
- Lagging indicator
- A measure of an outcome after it has happened, such as revenue booked.
- Leading indicator
- A measure that tends to come before an outcome and helps predict it, such as first meetings held.
- Fiscal year
- The twelve-month period a company uses for its accounts and targets; Ridgeline's runs from December 1 to November 30.
- Rate
- One count divided by another, such as deals won divided by deals closed.
- Goodhart's law
- The observation that when a measure becomes a target, people find ways to hit it that do not serve the goal behind it.
- Sample size
- The number of events behind a rate or average; small samples give noisy results.
Practice problems
Work each problem on paper first, then reveal the answer to check.
A team has an annual quota of 2,400,000 dollars and has booked 1,560,000 dollars after three quarters. What share has it attained, and what does it need in the last quarter?
Show answer
1,560,000 ÷ 2,400,000 = 0.65, or 65 in 100. It needs 2,400,000 − 1,560,000 = 840,000 dollars in the last quarter.
Name one leading and one lagging indicator.
Show answer
Leading: qualified opportunities created. Lagging: revenue booked.
Why is "my win rate is 100 in 100" not very informative after one month?
Show answer
It may rest on one or two deals; the sample is too small to show skill.
Lesson quiz · 5 questions
Score 60% or more to complete this lesson.
Create a free account to save your progress, take quizzes and earn a certificate.